| Falmouth, MA |
| Return to Regional/National map |
| County: Barnstable |
State: MA |
|
| Active Since: 2011 |
Observer: Goetz |
| Lat/Long: 41.5, -70.6 |
Landsat WRS Path/Row: 11/31 |
| MODIS TIle V/H: 4/12 |
MODIS Line, Samp: 1008.00, 865.50 |
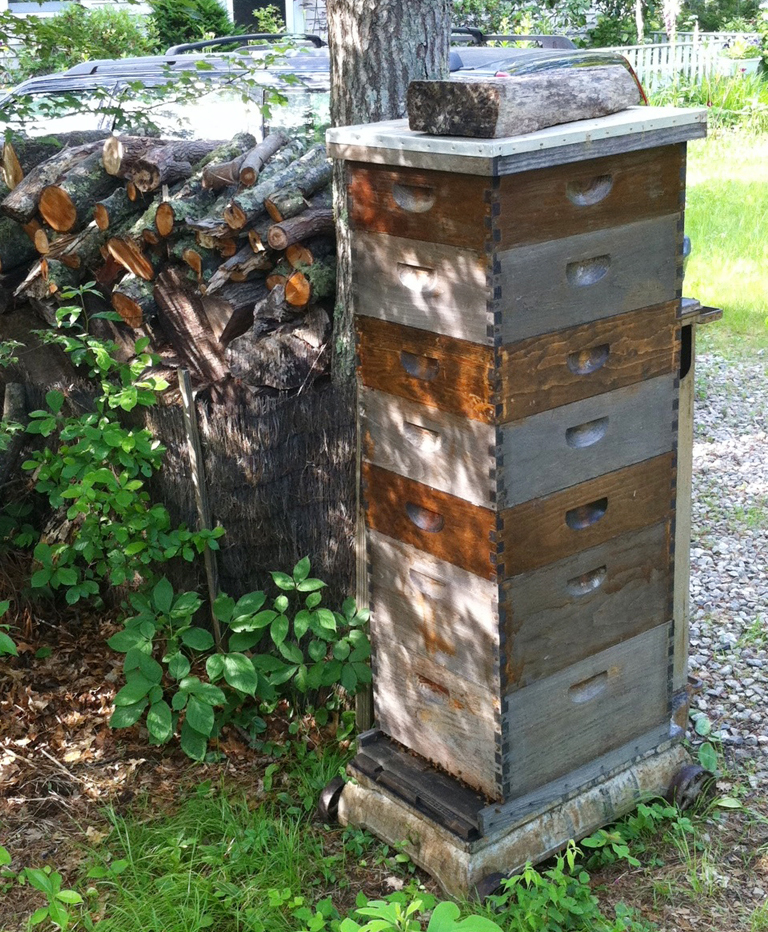
Site/Hive Description:
The site is located on western Cape Cod about 5 miles north of Falmouth. It’s a glaciated landscape characterized by moraines and sandy outwash plains with pot-hole lakes. Site is within a mile of a series of cranberry bogs along the Conamessett “river”. The natural vegetation is fairly dense oak and white pine, but includes a mixture of other hardwoods such as maple, cherry, locust and blackgum (tupelo). There are a variety of natural shrubs including sweet pepperbush, sassafras, high- and low-bush blueberry, and ornamentals including azeleas, rhododendrons, dogwoods and the like.
The hive is oriented facing West and the bees get several hours winter warming sun on the south side.
The scale is a Fairbanks 17x22” platform, 500 lb capacity, with 0.25 lb increments, leveled on wheels on the ground, exposed to weather
The double deep hive has a screened bottom board and telescoping cover, and is exposed to the elements. The colony was derived from a Kona queen but are now mixed with local bees of pleasant disposition.
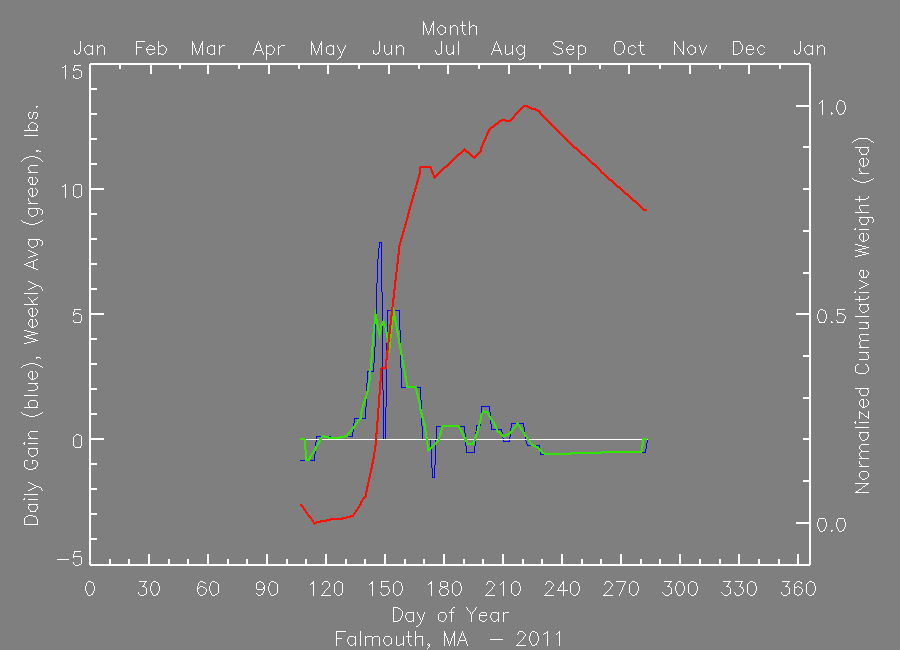
The bees forage on early ornamentals starting in April, derive most of their nectar from black locust beginning in early May, and forage on cultivated cranberries in June.
|
|
|
|
MODIS Subset Data (from the ORNL DAAC)
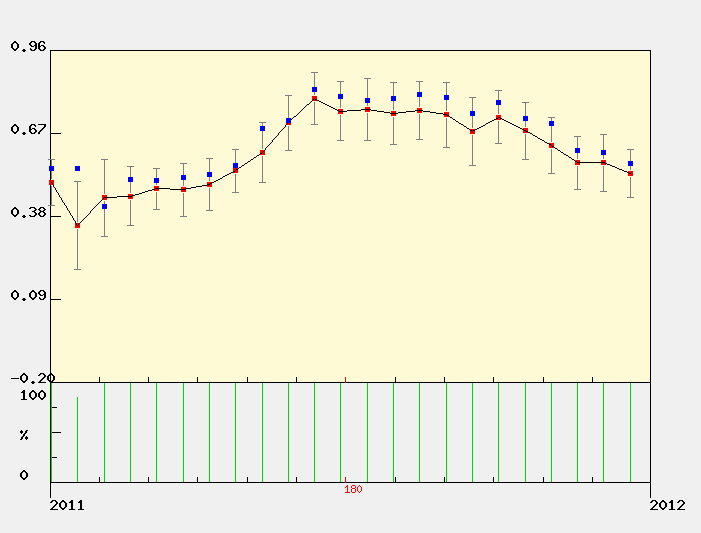
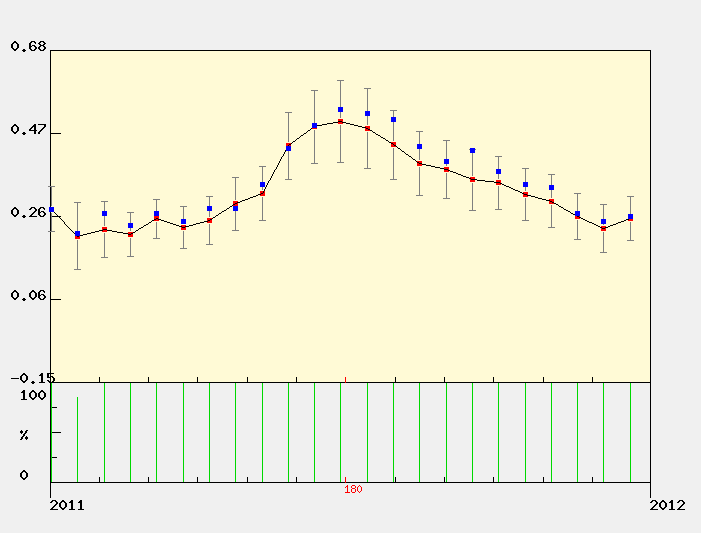
Red dots are the average of all pixels with acceptable quality (see landcover extract below for area covered).
Blue dots are the center pixel only (point is not plotted if the pixel is of unacceptable quality). |
| |
| NDVI The Normalized Difference Vegetation Index (NDVI) is the ratio of the difference between visible (red) and infra-red (IR) wavebands to the sum of these bands.
NDVI = nir - red / nir + red
NDVI provides an indication of the amount and vigor of vegetated surfaces.
NDVI has been widely used with multiple generations of satellite data.
|
 |
EVI
The Enhnaced Vegetation Index (EVI) is a more complicated combination of wavebands compared to the more widely used index, NDVI. The advantage of this newer index is improved sensitivity in high biomass regions and reduction in atmospheric influences.

where,
pNIR = NIR reflectance
pRed = red reflectance
pBlue = blue reflectance
C1 = atmosphere resistance red correction coefficient
C2 = atmosphere resistance blue correction coefficient
L = canopy background brightness
G = gain factor
|
|
The MODIS sensor on the Terra satellite platform provides us with 16-day composite measures of NDVI/EVI throughout the year. NASA distributes MODIS data from many of their distributed data centers.
|
|
|
|
MODIS Land Cover
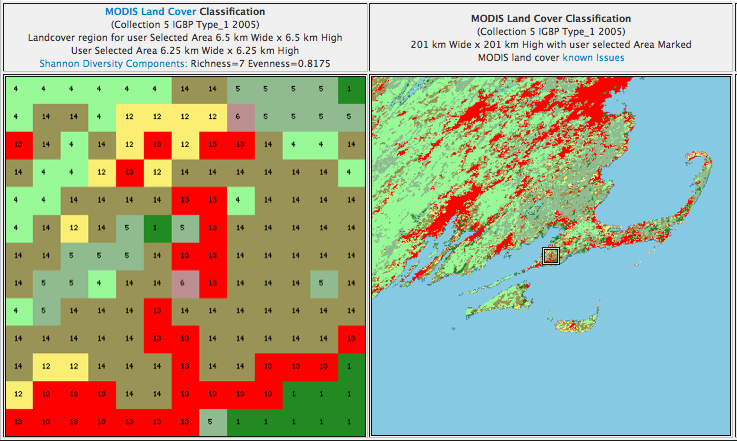

MODIS Data Subset Citation:
Oak Ridge National Laboratory Distributed Active Archive Center (ORNL DAAC). 2007. MODIS subsetted land products, Collection 4. Available on-line [http://www.daac.ornl.gov/MODIS/modis.html] from ORNL DAAC, Oak Ridge, Tennessee, U.S.A.. |
|
| |
| |
|