| Beltsville, MD |
| Return to Regional/National map |
| County: Prince Georges |
State: MD |
|
| Active Since: 2007 |
Observer: Smith |
| Lat/Long: 39, -76.9 |
Landsat WRS Path/Row: 15/33 |
| MODIS TIle V/H: 5/12 |
MODIS Line, Samp: 114.45, 35.67 |
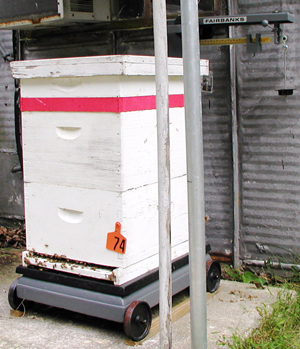
Site/Hive Description:
Hive is located is at the USDA’s Beltsville Agricultural Research Center (BARC) Bee Research Laboratory, next to building 483 with a northern exposure. The BARC facility is extensive and is adjacent to the USFWS Patuxent Wildlife Refuge, thus the site is located among extensive mature mixed hardwood and conifers, as well as crop and pasture lands within foraging radius. In the photo here, the red section indicates that there is mite medication on the colony. The box above that is a hive-top feeder for sugar syrup. Colony:
2 deeps plus supers during the summer. Italian queen. Scale:
Fairbanks Model 1124, 0.5 lb divisions, new in 2007. Weights maintained 2/07. Forage:
May Black Locust, Tulip Poplar
Late Spring/Summer White Clover
October Aster
|
|
|
|
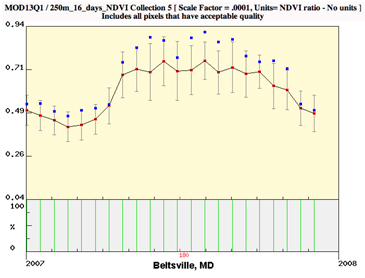
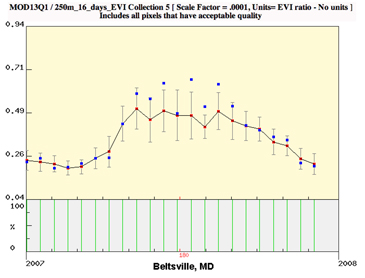
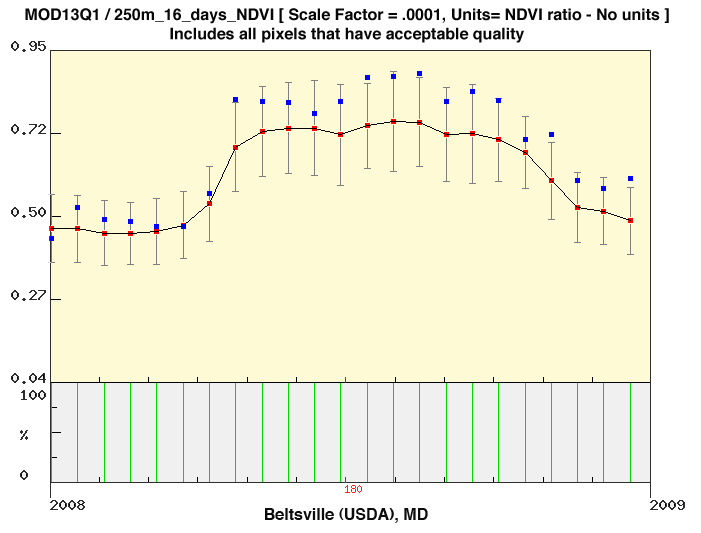
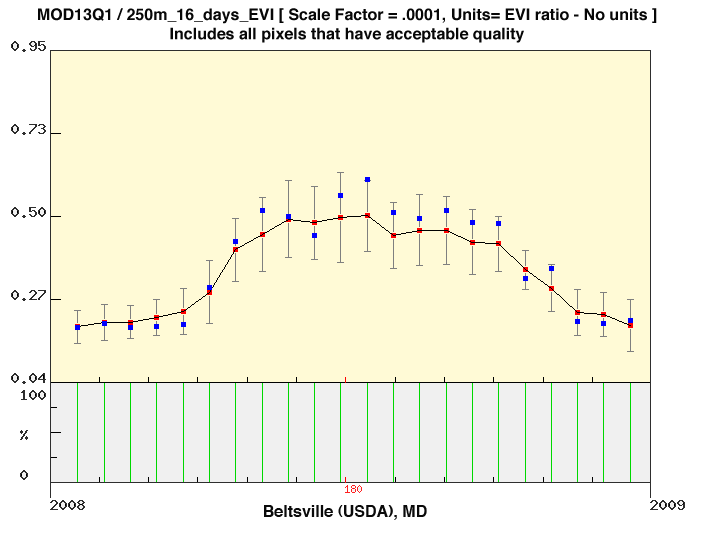
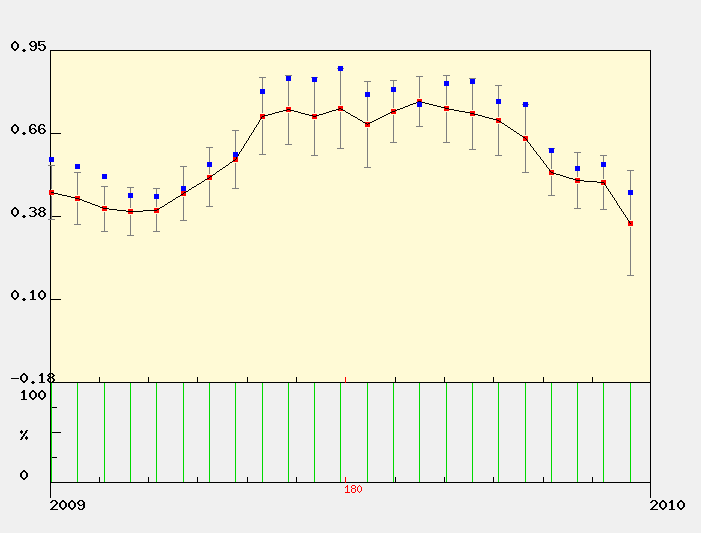
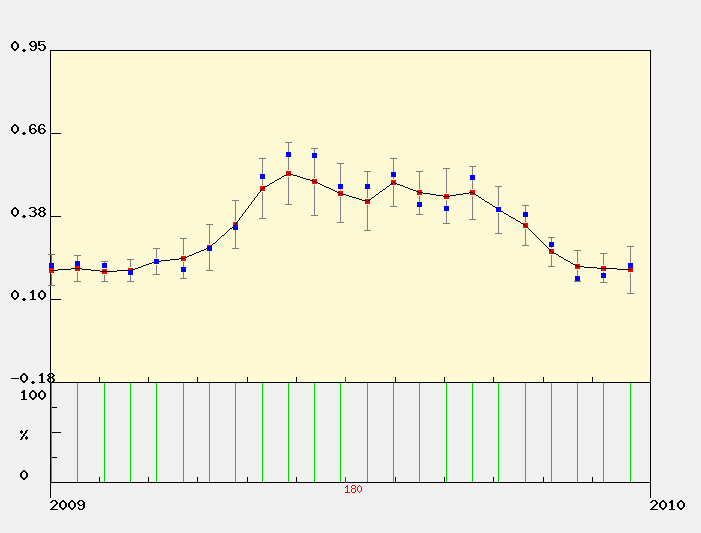
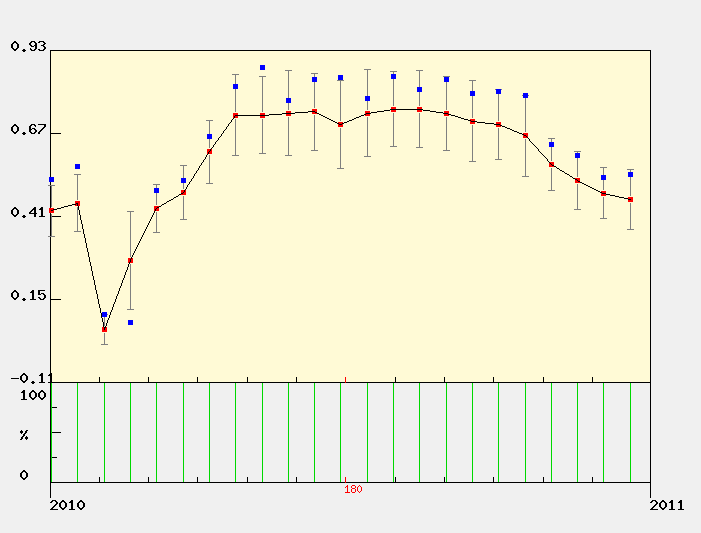
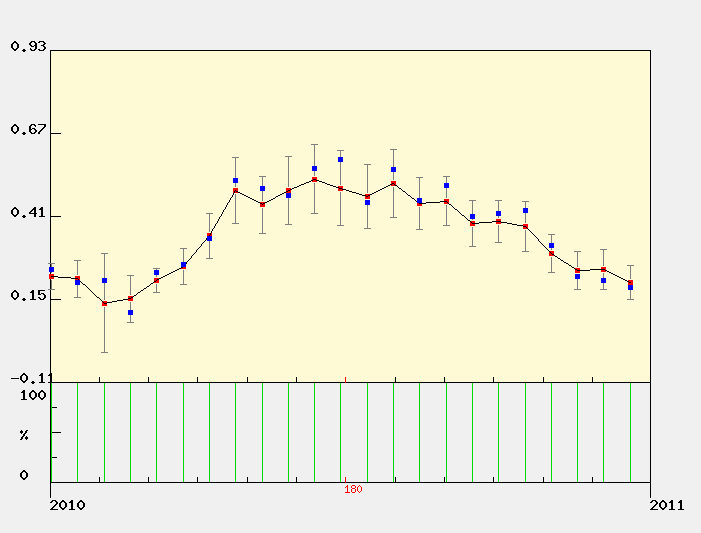
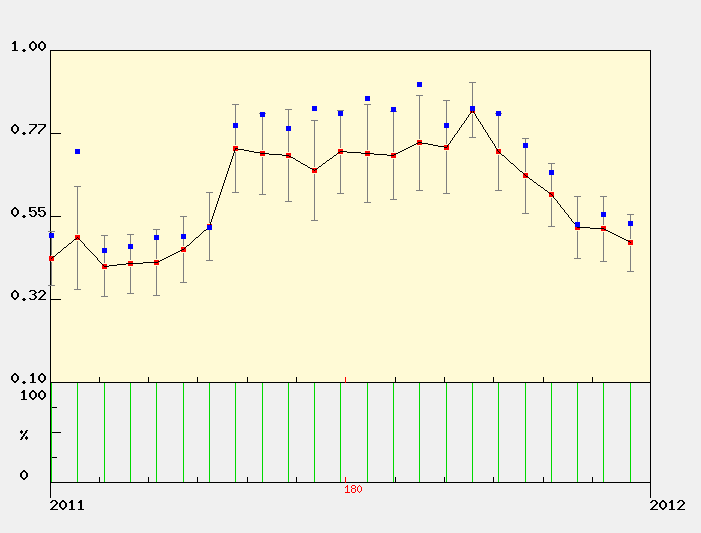
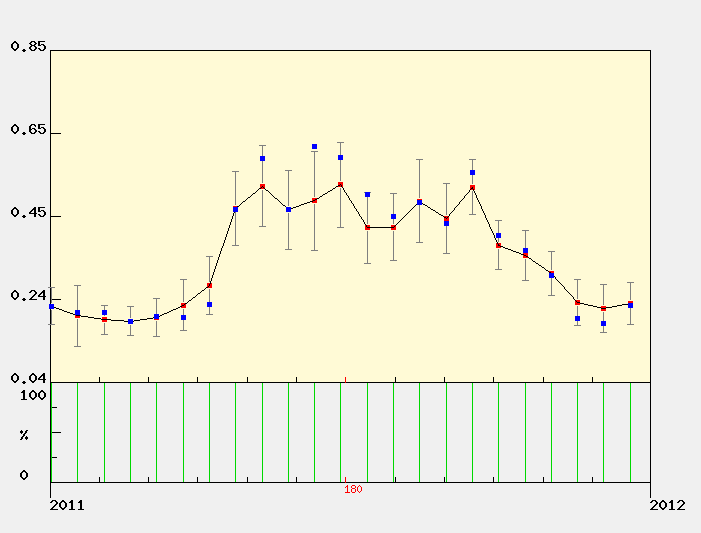
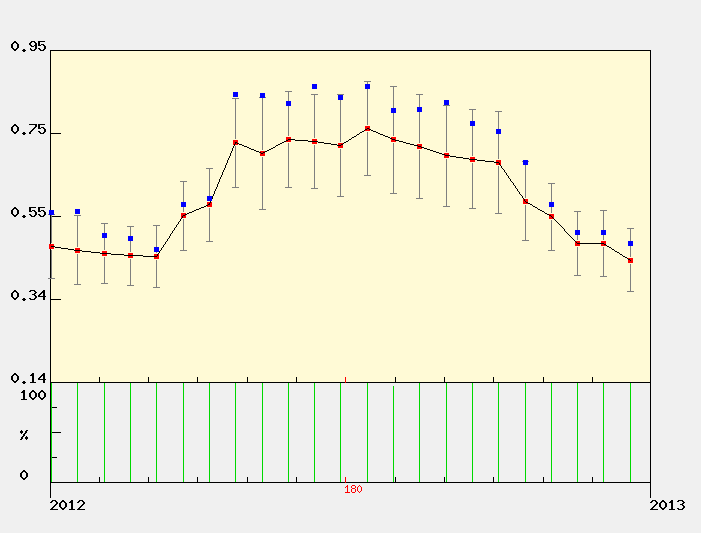
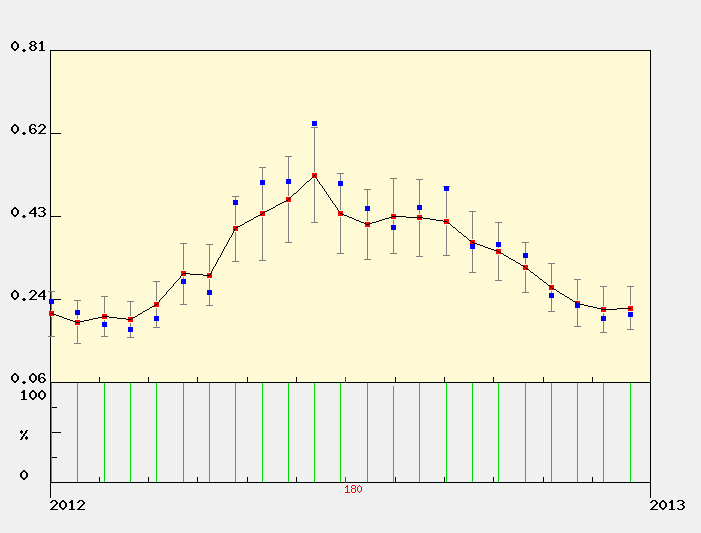
MODIS Subset Data (from the ORNL DAAC)
Red dots are the average of all pixels with acceptable quality (see landcover extract below for area covered).
Blue dots are the center pixel only (point is not plotted if the pixel is of unacceptable quality). |
| | | | | | | | | | | |
| NDVI The Normalized Difference Vegetation Index (NDVI) is the ratio of the difference between visible (red) and infra-red (IR) wavebands to the sum of these bands.
NDVI = nir - red / nir + red
NDVI provides an indication of the amount and vigor of vegetated surfaces.
NDVI has been widely used with multiple generations of satellite data.
|
 |
EVI
The Enhnaced Vegetation Index (EVI) is a more complicated combination of wavebands compared to the more widely used index, NDVI. The advantage of this newer index is improved sensitivity in high biomass regions and reduction in atmospheric influences.

where,
pNIR = NIR reflectance
pRed = red reflectance
pBlue = blue reflectance
C1 = atmosphere resistance red correction coefficient
C2 = atmosphere resistance blue correction coefficient
L = canopy background brightness
G = gain factor
|
|
The MODIS sensor on the Terra satellite platform provides us with 16-day composite measures of NDVI/EVI throughout the year. NASA distributes MODIS data from many of their distributed data centers.
|
|
|
|
MODIS Land Cover
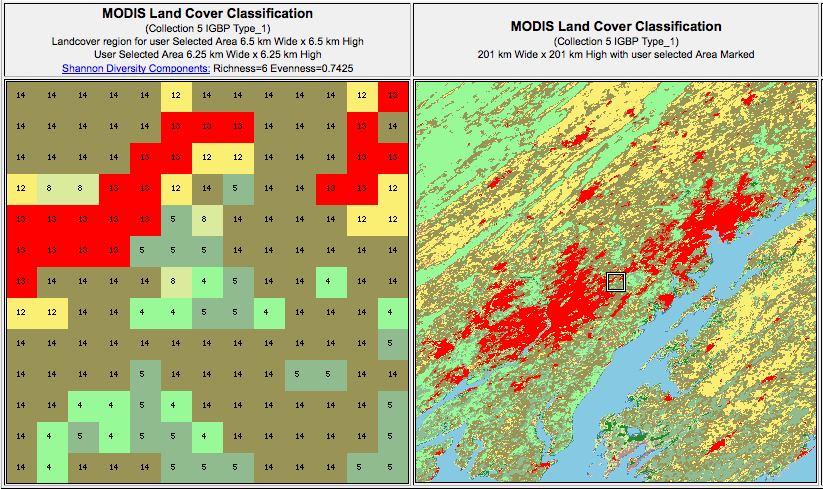

MODIS Data Subset Citation:
Oak Ridge National Laboratory Distributed Active Archive Center (ORNL DAAC). 2007. MODIS subsetted land products, Collection 4. Available on-line [http://www.daac.ornl.gov/MODIS/modis.html] from ORNL DAAC, Oak Ridge, Tennessee, U.S.A.. |
|
| |
| |
|


,MD_plot.png)