| College Park, MD |
| Return to Regional/National map |
| County: Prince Georges |
State: MD |
|
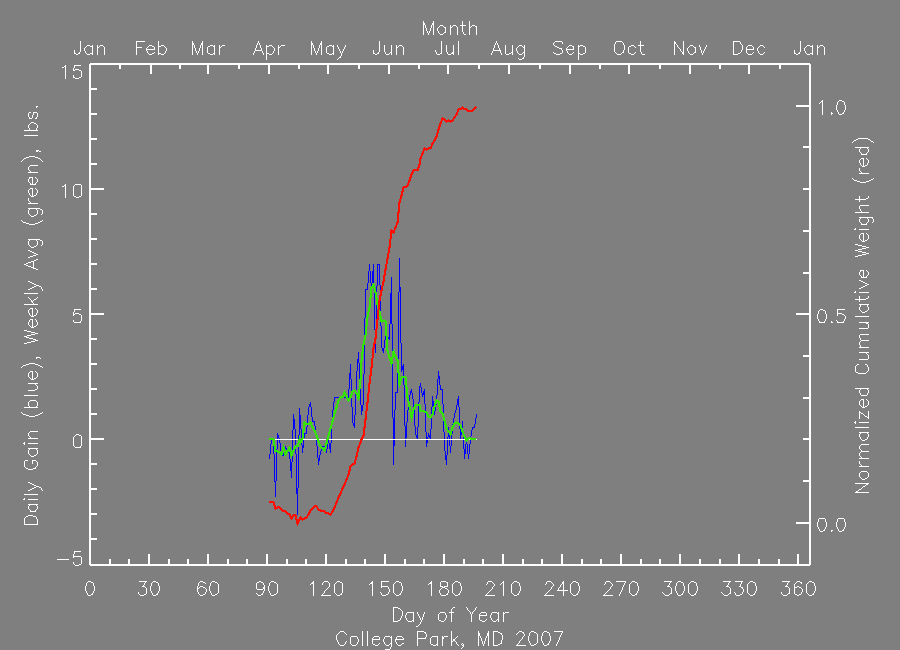
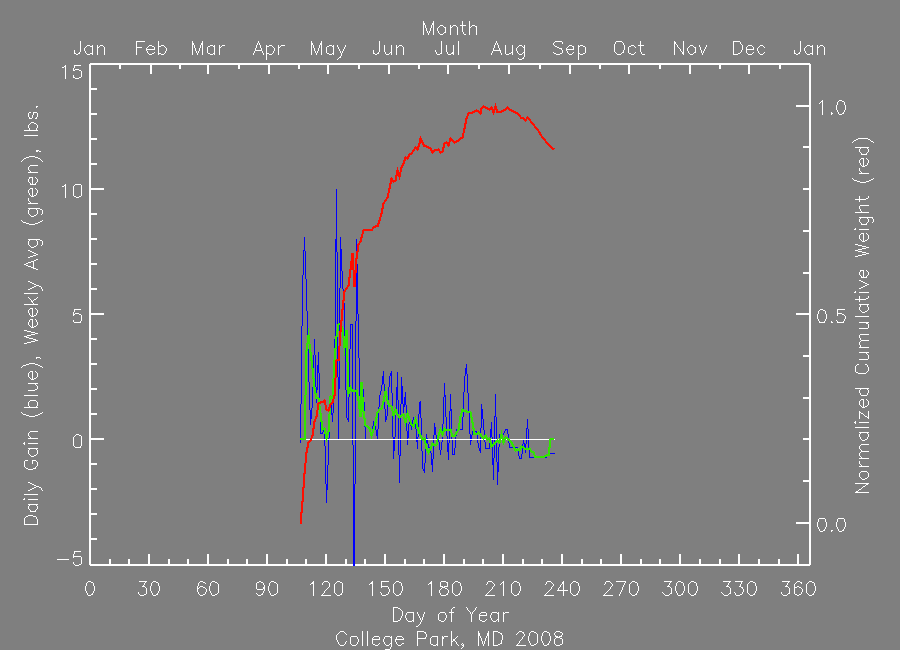
| Active Since: 2007 |
Observer: Hellman |
| Lat/Long: 38.9, -76.9 |
Landsat WRS Path/Row: 15/33 |
| MODIS TIle V/H: 5/12 |
MODIS Line, Samp: 120.51, 22.63 |
Site/Hive Description:
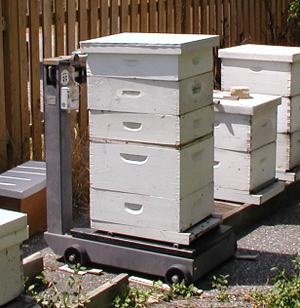
Located at the UMD Apiary (adjacent to Byrd Stadium) near the center of this campus in an older urban/residential area. There are many mature hardwoods nearby, primarily oak and Tulip Poplar, with some conifer also mixed in. The site is also the same as that of Abrams’ records from the 1950’s. The campus and surrounding areas have seen considerable development, and the area is classified as urban/built up. The site is about 0.4 km from two golf courses. Soil is coastal plain sandy clay, and the mean elevation is 150 ft. Scale: Detecto 1000 lb capacity, 0.5 lb divisions, circa 1990. Weights maintained 3/07.
|
|
|
|
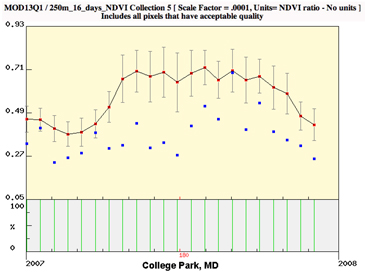
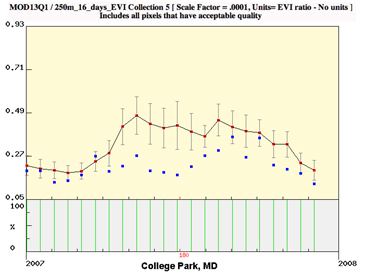
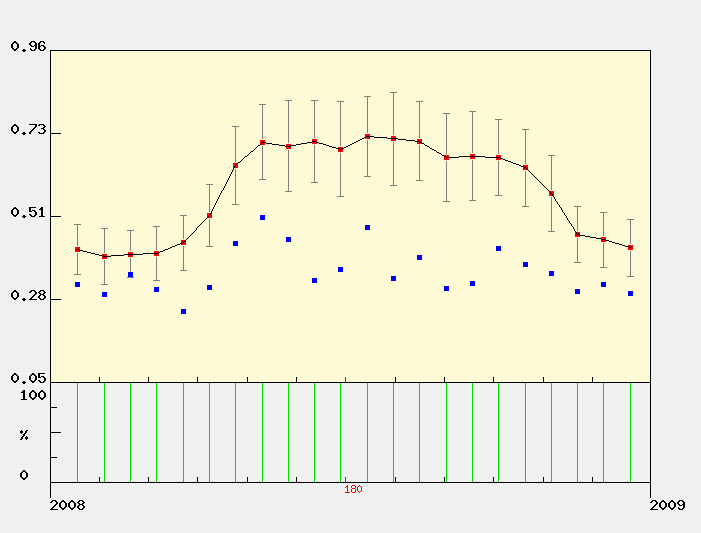
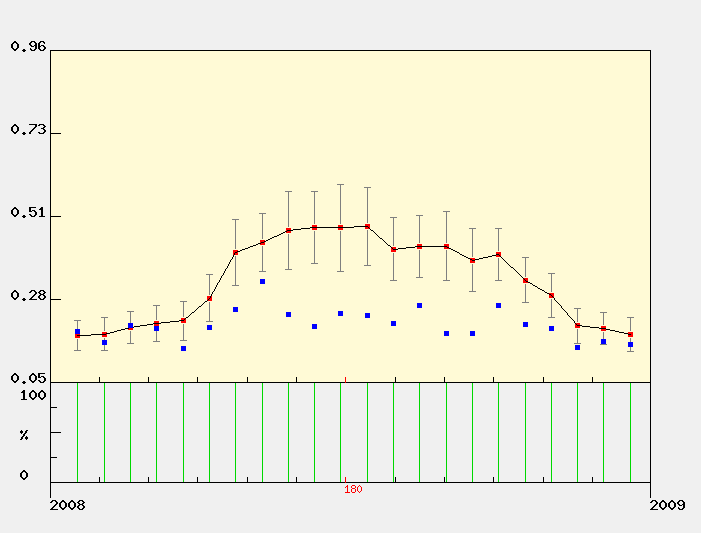
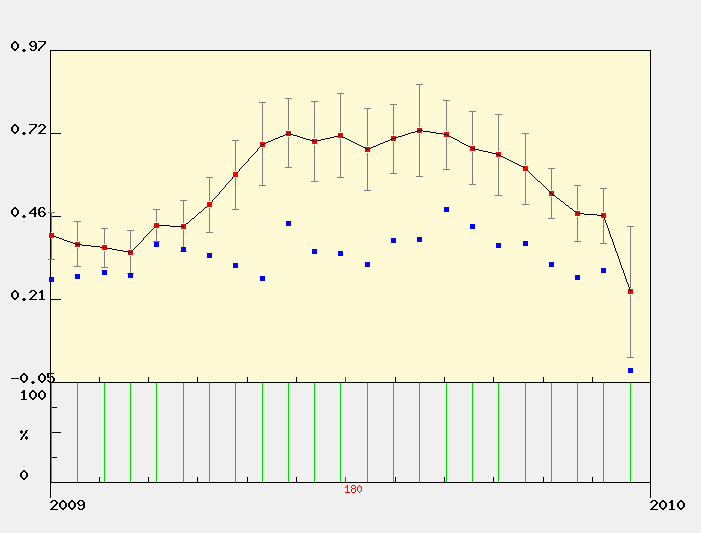
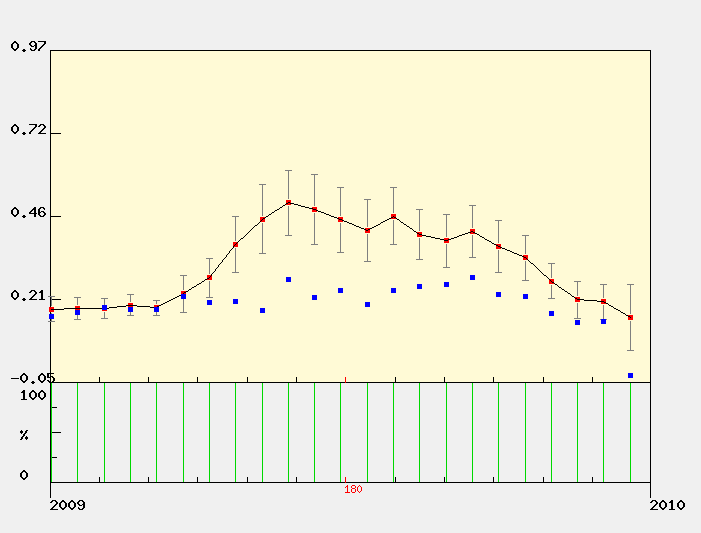
MODIS Subset Data (from the ORNL DAAC)
Red dots are the average of all pixels with acceptable quality (see landcover extract below for area covered).
Blue dots are the center pixel only (point is not plotted if the pixel is of unacceptable quality). |
| | | | | |
| NDVI The Normalized Difference Vegetation Index (NDVI) is the ratio of the difference between visible (red) and infra-red (IR) wavebands to the sum of these bands.
NDVI = nir - red / nir + red
NDVI provides an indication of the amount and vigor of vegetated surfaces.
NDVI has been widely used with multiple generations of satellite data.
|
 |
EVI
The Enhnaced Vegetation Index (EVI) is a more complicated combination of wavebands compared to the more widely used index, NDVI. The advantage of this newer index is improved sensitivity in high biomass regions and reduction in atmospheric influences.

where,
pNIR = NIR reflectance
pRed = red reflectance
pBlue = blue reflectance
C1 = atmosphere resistance red correction coefficient
C2 = atmosphere resistance blue correction coefficient
L = canopy background brightness
G = gain factor
|
|
The MODIS sensor on the Terra satellite platform provides us with 16-day composite measures of NDVI/EVI throughout the year. NASA distributes MODIS data from many of their distributed data centers.
|
|
|
|
MODIS Land Cover
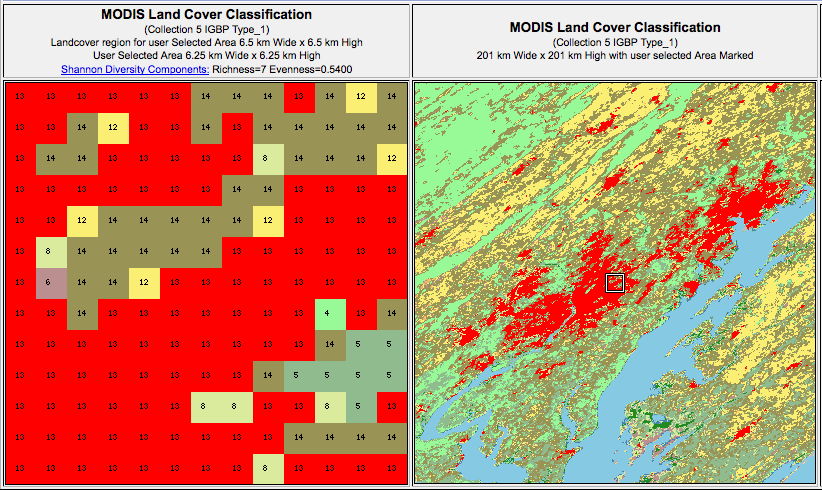

MODIS Data Subset Citation:
Oak Ridge National Laboratory Distributed Active Archive Center (ORNL DAAC). 2007. MODIS subsetted land products, Collection 4. Available on-line [http://www.daac.ornl.gov/MODIS/modis.html] from ORNL DAAC, Oak Ridge, Tennessee, U.S.A.. |
|
| |
| |
|