Skip all navigation and jump to content Jump to site navigation Jump to section navigation.
nasa meatball GSFC
NASA Logo - Goddard Space Flight Center + Visit NASA.gov
HoneyBeeNet banner image
ABOUT SCALE HIVES HONEYBEES SITE DATA NEWS LINKS
Rockville, MD
Return to Regional/National map
County:  Montgomery State: MD
Active Since: 2009 Observer: Reed
Lat/Long: 39, -77.1 Landsat WRS Path/Row: 15/33
MODIS TIle V/H: 5/12 MODIS Line, Samp: 110.79, 14.72

Site/Hive Description:

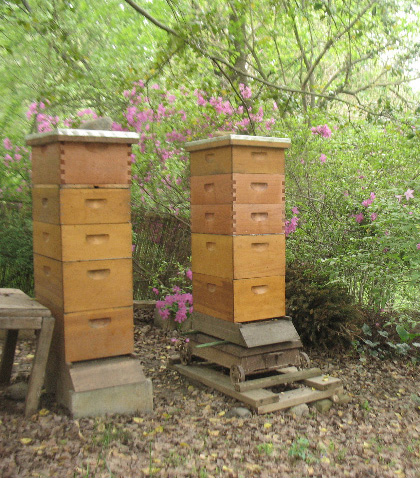
Hive is located in the backyard in a suburban setting under nearly full canopy mixed broadleaf forest with mid-day sun exposure. The location is adjacent to a creek and trail in Rock Crest Park.

The scale is an old Fairbanks, 0.25 lb divisions, checked by W. Esaias in 12/09, and weights were maintained to within 0.5 g.

The colony consists of Italian bees and plans are to requeen with hygienic stock.
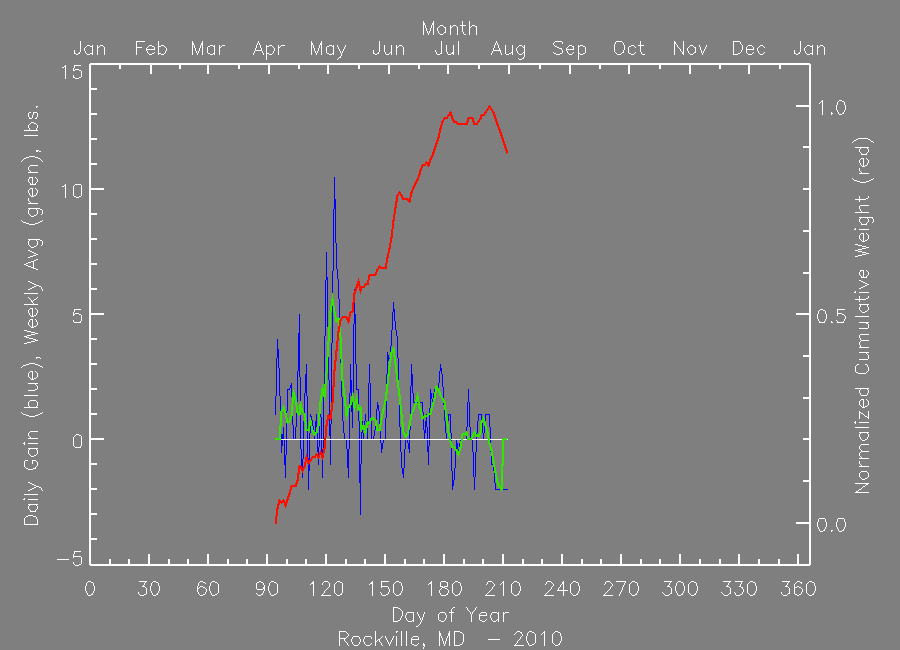
Forage:
Black locust, Tulip Poplar (May– June), Clover (May–Aug), Wild Cherry, Redbud (Apr), Borage, Hyssop, Zebrina, Cone flower, Butterfly weed (Jun-Aug), Aster, Goldenrod (Sep-Oct).


Nectar Flow Data 2010

Download Data File (comma delimited), download QA flag key


MODIS Subset Data (from the ORNL DAAC)
Red dots are the average of all pixels with acceptable quality (see landcover extract below for area covered).
Blue dots are the center pixel only (point is not plotted if the pixel is of unacceptable quality).


NDVI

The Normalized Difference Vegetation Index (NDVI) is the ratio of the  difference between visible (red) and infra-red (IR) wavebands to the sum of these bands. 

NDVI = nir - red / nir + red


 NDVI provides an indication of the amount and vigor of vegetated  surfaces. 

 NDVI has been widely used with multiple generations of satellite data.

EVI

 The Enhnaced Vegetation Index (EVI) is a more complicated combination of wavebands compared to the more widely used index, NDVI.  The advantage of this newer index is improved sensitivity in high biomass regions and reduction in atmospheric influences.
where,
pNIR = NIR reflectance
pRed = red reflectance
pBlue = blue reflectance
C1 = atmosphere resistance red correction coefficient
C2 = atmosphere resistance blue correction coefficient
L = canopy background brightness
G = gain factor


The MODIS sensor on the Terra satellite platform provides us with 16-day composite measures of NDVI/EVI throughout the year.  NASA distributes MODIS data from many of their distributed data centers.

MODIS Land Cover

MODIS Data Subset Citation:
Oak Ridge National Laboratory Distributed Active Archive Center (ORNL DAAC). 2007. MODIS subsetted land products, Collection 4. Available on-line [http://www.daac.ornl.gov/MODIS/modis.html] from ORNL DAAC, Oak Ridge, Tennessee, U.S.A..


FirstGov logo + Privacy Policy and Important Notices NASA Curator: Jaime Nickeson
NASA Official: Sadashiva Devadiga
Last Updated: February 1, 2024