Skip all navigation and jump to content Jump to site navigation Jump to section navigation.
nasa meatball GSFC
NASA Logo - Goddard Space Flight Center + Visit NASA.gov
HoneyBeeNet banner image
ABOUT SCALE HIVES HONEYBEES SITE DATA NEWS LINKS
UMDfarm, MD
Return to Regional/National map
County:  Prince Georges State: MD
Active Since: 2009 Observer: Dively
Lat/Long: 39, -76.8 Landsat WRS Path/Row: 15/33
MODIS TIle V/H: 5/12 MODIS Line, Samp: 118.34, 35.50

Site/Hive Description:

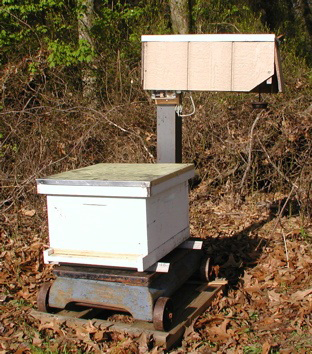
Located at the UMD Beltsville Environmental Research Center. The hive is oriented toward the SE adjacent to a wooded area, facing an agricultural field (corn and soybeans). Woodland is mixed deciduous forest and wetlands. The hive is one of 40 used in a study of sublethal effects of pesticides on colony health.

Scale is a Fairbanks 17 by 22 in. platform, 1000 lb capacity, 0.25 lb increments, leveled on a 2 by 8 ft. base, exposed to weather but with a cover over the beam. Equipped with NASA electronic logger, Version 1, recording at 10 min. intervals.

Colony and hive consist of a three pound package installed in early May 2009 in a single deep hive body. A second hive body was added on May 28.

Forage is primarily tulip poplar, black locust, clover, aster, goldenrod and basswood.


Nectar Flow Data 2009

Download Data File (comma delimited), download QA flag key


MODIS Subset Data (from the ORNL DAAC)
Red dots are the average of all pixels with acceptable quality (see landcover extract below for area covered).
Blue dots are the center pixel only (point is not plotted if the pixel is of unacceptable quality).


NDVI

The Normalized Difference Vegetation Index (NDVI) is the ratio of the  difference between visible (red) and infra-red (IR) wavebands to the sum of these bands. 

NDVI = nir - red / nir + red


 NDVI provides an indication of the amount and vigor of vegetated  surfaces. 

 NDVI has been widely used with multiple generations of satellite data.

EVI

 The Enhnaced Vegetation Index (EVI) is a more complicated combination of wavebands compared to the more widely used index, NDVI.  The advantage of this newer index is improved sensitivity in high biomass regions and reduction in atmospheric influences.
where,
pNIR = NIR reflectance
pRed = red reflectance
pBlue = blue reflectance
C1 = atmosphere resistance red correction coefficient
C2 = atmosphere resistance blue correction coefficient
L = canopy background brightness
G = gain factor


The MODIS sensor on the Terra satellite platform provides us with 16-day composite measures of NDVI/EVI throughout the year.  NASA distributes MODIS data from many of their distributed data centers.

MODIS Land Cover

MODIS Data Subset Citation:
Oak Ridge National Laboratory Distributed Active Archive Center (ORNL DAAC). 2007. MODIS subsetted land products, Collection 4. Available on-line [http://www.daac.ornl.gov/MODIS/modis.html] from ORNL DAAC, Oak Ridge, Tennessee, U.S.A..


FirstGov logo + Privacy Policy and Important Notices NASA Curator: Jaime Nickeson
NASA Official: Sadashiva Devadiga
Last Updated: February 1, 2024