Skip all navigation and jump to content Jump to site navigation Jump to section navigation.
nasa meatball GSFC
NASA Logo - Goddard Space Flight Center + Visit NASA.gov
HoneyBeeNet banner image
ABOUT SCALE HIVES HONEYBEES SITE DATA NEWS LINKS
St. Leonard, MD
Return to Regional/National map
County:  Calvert State: MD
Active Since: 2010 Observer: Brown
Lat/Long: 38.3, -76.5 Landsat WRS Path/Row: 14/33
MODIS TIle V/H: 5/12 MODIS Line, Samp: 191.98, 4.51

Site/Hive Description:

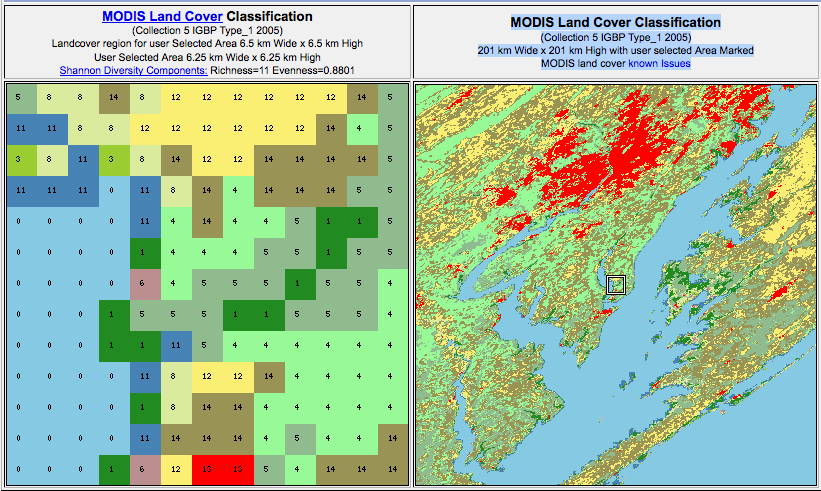
The apiary is 250 ft and 75 ft uphill from St. Leonard Creek on the N shore of the Patuxent River. Well protected by trees and a garage from the prevailing winter winds in a natural landscape. The area is heavily wooded. Within a half-mile radius are 8 residences and 2 research labs with 45% deciduous woods, 25% fields of soy and corn, 15% saltwater, and 15% pine woods.

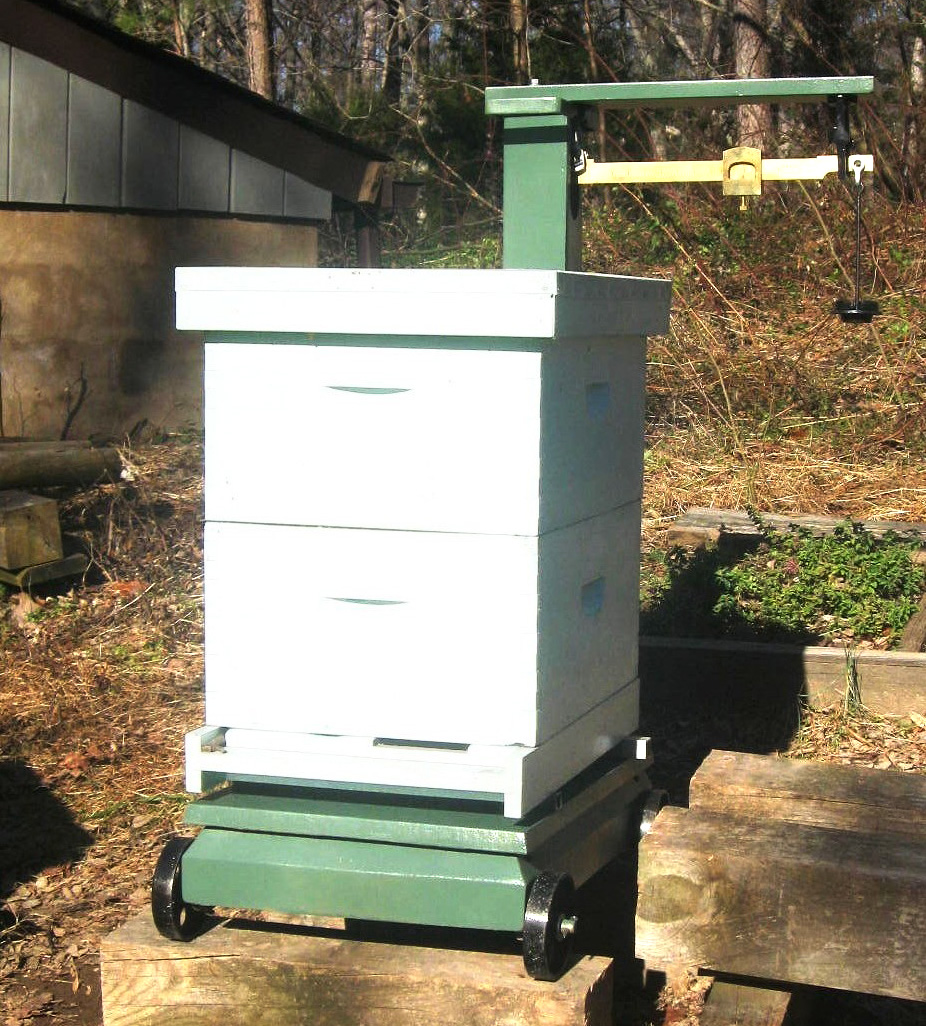
The scale is a new (2009) Chatillon, 600 lb cap, 0.25 lb div., on a good base.

The colony is in deep brood boxes, and no particular swarm prevention procedures are used to aid feral populations.

Significant forage sources are pin cherry (Mar-Apr), black cherry (Apr), Black Locust (Apr-May), Tulip tree and Am. Holly (May), raspberry, blackberry (May-Jun), and goldenrod/aster (Aug-Sep).


Nectar Flow Data 2010

Download Data File (comma delimited), download QA flag key


Nectar Flow Data 2011

Download Data File (comma delimited), download QA flag key


Nectar Flow Data 2012

Download Data File (comma delimited), download QA flag key


MODIS Subset Data (from the ORNL DAAC)
Red dots are the average of all pixels with acceptable quality (see landcover extract below for area covered).
Blue dots are the center pixel only (point is not plotted if the pixel is of unacceptable quality).


NDVI

The Normalized Difference Vegetation Index (NDVI) is the ratio of the  difference between visible (red) and infra-red (IR) wavebands to the sum of these bands. 

NDVI = nir - red / nir + red


 NDVI provides an indication of the amount and vigor of vegetated  surfaces. 

 NDVI has been widely used with multiple generations of satellite data.

EVI

 The Enhnaced Vegetation Index (EVI) is a more complicated combination of wavebands compared to the more widely used index, NDVI.  The advantage of this newer index is improved sensitivity in high biomass regions and reduction in atmospheric influences.
where,
pNIR = NIR reflectance
pRed = red reflectance
pBlue = blue reflectance
C1 = atmosphere resistance red correction coefficient
C2 = atmosphere resistance blue correction coefficient
L = canopy background brightness
G = gain factor


The MODIS sensor on the Terra satellite platform provides us with 16-day composite measures of NDVI/EVI throughout the year.  NASA distributes MODIS data from many of their distributed data centers.

MODIS Land Cover

MODIS Data Subset Citation:
Oak Ridge National Laboratory Distributed Active Archive Center (ORNL DAAC). 2007. MODIS subsetted land products, Collection 4. Available on-line [http://www.daac.ornl.gov/MODIS/modis.html] from ORNL DAAC, Oak Ridge, Tennessee, U.S.A..


FirstGov logo + Privacy Policy and Important Notices NASA Curator: Jaime Nickeson
NASA Official: Sadashiva Devadiga
Last Updated: February 1, 2024