| Leonardtown, MD |
| Return to Regional/National map |
| County: St. Mary's |
State: MD |
|
| Active Since: 2011 |
Observer: Julian |
| Lat/Long: 38.3, -76.7 |
Landsat WRS Path/Row: 15/33 |
| MODIS TIle V/H: 0/0 |
MODIS Line, Samp: 0.00, 0.00 |
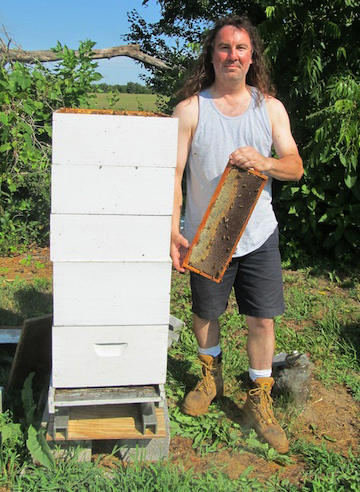
Site/Hive Description:
This site is maintained on private 38-acre farm adjacent to the beekeeper’s home. The apiary of 4-6 colonies is surrounded by a mosaic of cropland/woodland that is common in much of the coastal western shore of the Chesapeake Bay region. Primary crops grown in the area are soybeans and corn. The scattered broad-leafed deciduous woodlands contain oaks, maples, tulip trees, with forbs like clover, goldenrod and other wildflowers along margins and hedgerows. Colony:
The colony was headed by an Italian queen, in deep Langstroth brood chambers with shallow supers.
|
|
|
|
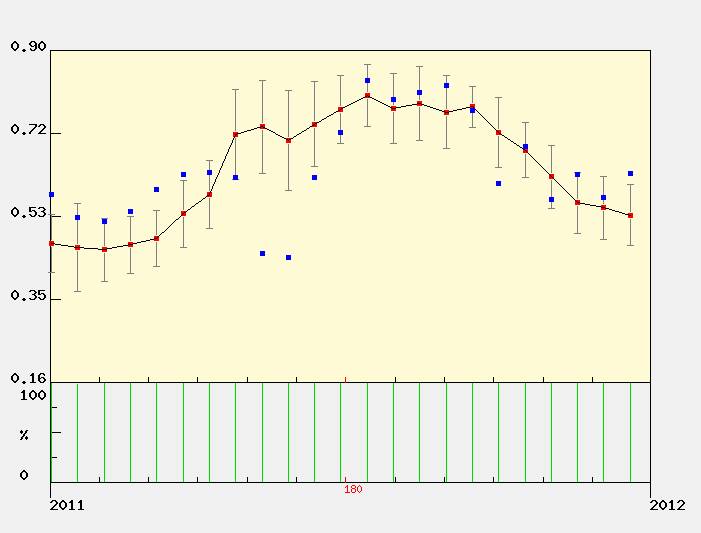
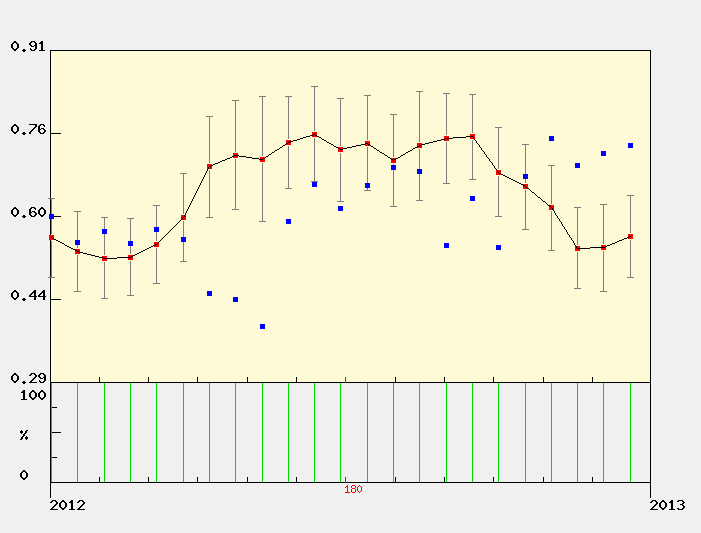
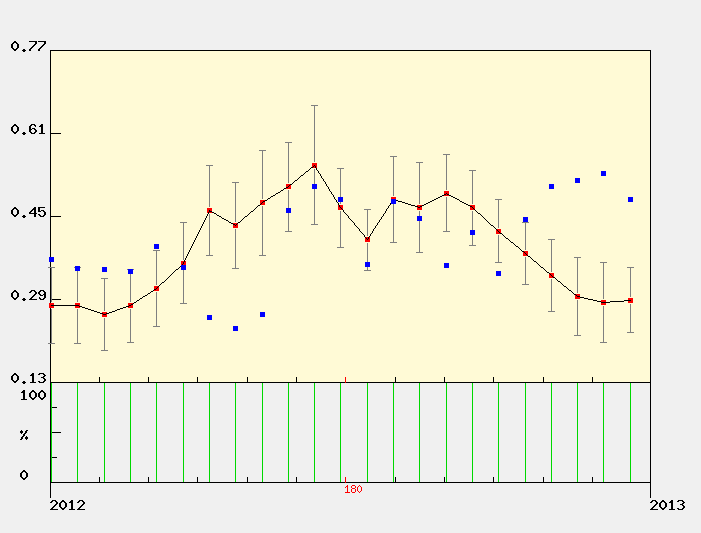
MODIS Subset Data (from the ORNL DAAC)
Red dots are the average of all pixels with acceptable quality (see landcover extract below for area covered).
Blue dots are the center pixel only (point is not plotted if the pixel is of unacceptable quality). |
| | | |
| NDVI The Normalized Difference Vegetation Index (NDVI) is the ratio of the difference between visible (red) and infra-red (IR) wavebands to the sum of these bands.
NDVI = nir - red / nir + red
NDVI provides an indication of the amount and vigor of vegetated surfaces.
NDVI has been widely used with multiple generations of satellite data.
|
 |
EVI
The Enhnaced Vegetation Index (EVI) is a more complicated combination of wavebands compared to the more widely used index, NDVI. The advantage of this newer index is improved sensitivity in high biomass regions and reduction in atmospheric influences.

where,
pNIR = NIR reflectance
pRed = red reflectance
pBlue = blue reflectance
C1 = atmosphere resistance red correction coefficient
C2 = atmosphere resistance blue correction coefficient
L = canopy background brightness
G = gain factor
|
|
The MODIS sensor on the Terra satellite platform provides us with 16-day composite measures of NDVI/EVI throughout the year. NASA distributes MODIS data from many of their distributed data centers.
|
|
|
|
MODIS Land Cover
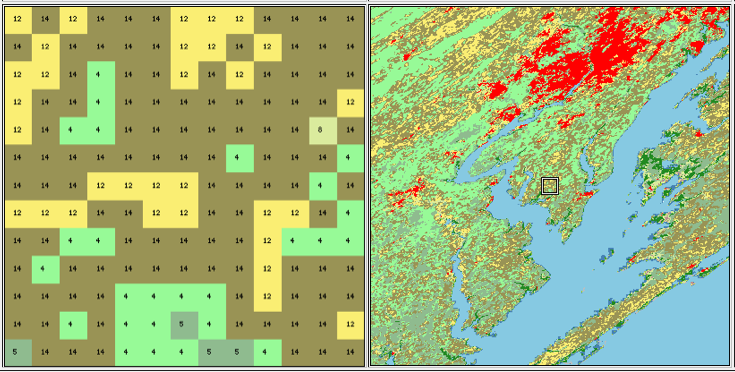

MODIS Data Subset Citation:
Oak Ridge National Laboratory Distributed Active Archive Center (ORNL DAAC). 2007. MODIS subsetted land products, Collection 4. Available on-line [http://www.daac.ornl.gov/MODIS/modis.html] from ORNL DAAC, Oak Ridge, Tennessee, U.S.A.. |
|
| |
| |
|