Skip all navigation and jump to content Jump to site navigation Jump to section navigation.
nasa meatball GSFC
NASA Logo - Goddard Space Flight Center + Visit NASA.gov
HoneyBeeNet banner image
ABOUT SCALE HIVES HONEYBEES SITE DATA NEWS LINKS
Annapolis, MD
Return to Regional/National map
County:  Anne Arundel State: MD
Active Since: 2012 Observer: Lucid
Lat/Long: 39, -76.5 Landsat WRS Path/Row: 0/0
MODIS TIle V/H: 0/0 MODIS Line, Samp: 0.00, 0.00

Site/Hive Description:

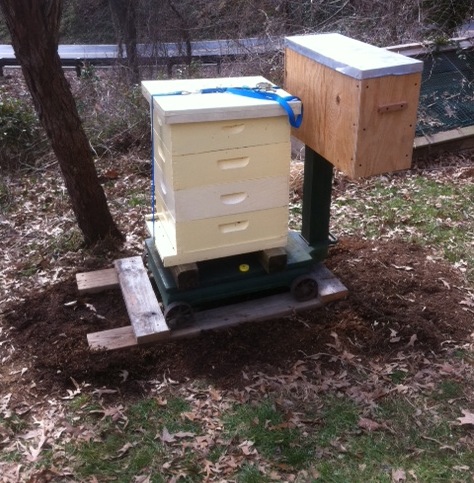
The hive is located on an escarpment on the banks of Weems Creek in Annapolis, in a tree covered residential area. Well sheltered from NW winds.

Colony:
.The colony is in 4 10 frame medium boxes, without excluder, with an additional super added in April, and is an Italian strain.

Scale:
A reconditioned Fairbanks 500 lb (.25 d), well calibrated by WE, on a leveled wood platform resting on pavers, with a cover for the beam.

Forage:
Major spring sources are henbit, black locust. Holly and Tulip poplar are abundant, and host of exotic landscape sp.


Nectar Flow Data 2012

Download Data File (comma delimited), download QA flag key


MODIS Subset Data (from the ORNL DAAC)
Red dots are the average of all pixels with acceptable quality (see landcover extract below for area covered).
Blue dots are the center pixel only (point is not plotted if the pixel is of unacceptable quality).


NDVI

The Normalized Difference Vegetation Index (NDVI) is the ratio of the  difference between visible (red) and infra-red (IR) wavebands to the sum of these bands. 

NDVI = nir - red / nir + red


 NDVI provides an indication of the amount and vigor of vegetated  surfaces. 

 NDVI has been widely used with multiple generations of satellite data.

EVI

 The Enhnaced Vegetation Index (EVI) is a more complicated combination of wavebands compared to the more widely used index, NDVI.  The advantage of this newer index is improved sensitivity in high biomass regions and reduction in atmospheric influences.
where,
pNIR = NIR reflectance
pRed = red reflectance
pBlue = blue reflectance
C1 = atmosphere resistance red correction coefficient
C2 = atmosphere resistance blue correction coefficient
L = canopy background brightness
G = gain factor


The MODIS sensor on the Terra satellite platform provides us with 16-day composite measures of NDVI/EVI throughout the year.  NASA distributes MODIS data from many of their distributed data centers.

MODIS Land Cover

MODIS Data Subset Citation:
Oak Ridge National Laboratory Distributed Active Archive Center (ORNL DAAC). 2007. MODIS subsetted land products, Collection 4. Available on-line [http://www.daac.ornl.gov/MODIS/modis.html] from ORNL DAAC, Oak Ridge, Tennessee, U.S.A..


FirstGov logo + Privacy Policy and Important Notices NASA Curator: Jaime Nickeson
NASA Official: Sadashiva Devadiga
Last Updated: February 1, 2024