Skip all navigation and jump to content Jump to site navigation Jump to section navigation.
nasa meatball GSFC
NASA Logo - Goddard Space Flight Center + Visit NASA.gov
HoneyBeeNet banner image
ABOUT SCALE HIVES HONEYBEES SITE DATA NEWS LINKS
Parkton, MD
Return to Regional/National map
County:  Baltimore State: MD
Active Since: 2012 Observer: Kampes
Lat/Long: 39.6, -76.7 Landsat WRS Path/Row: 0/0
MODIS TIle V/H: 0/0 MODIS Line, Samp: 0.00, 0.00

Site/Hive Description:

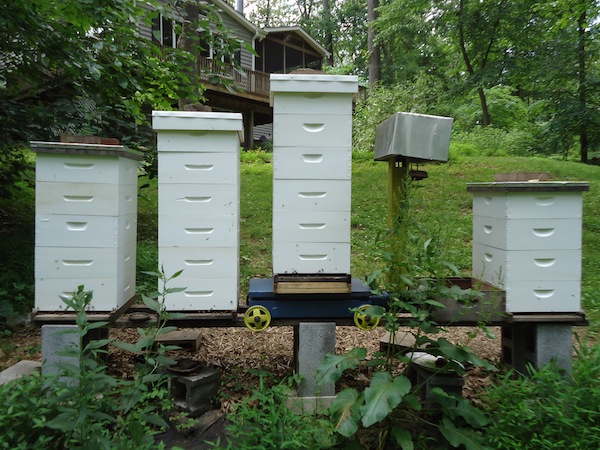
Located in the Piedmont region of N. Maryland, in a rural setting. Landscape is mixed cropland and deciduous woodland, near the Gunpowder River and Prettyboy Reservoir.

Colony:
The hive is in the second season, Italian bees, kept foundationless in medium boxes.

Scale:
A reconditioned Detecto 500 lb capacity platform scale that was formerly used at MD034 2009-10. Exposed to the weather, with a cover for the beam.

Forage:
Skunk cabbage, Willow, Maple, Dandelion, Mustard, Redbud, fruit trees,Bush Honeysuckle, Tulip Poplar, Black Locust, Hollies, Dutch Clover, Berries, Sumac, Goldenrod, Asters.


Nectar Flow Data 2012

Download Data File (comma delimited), download QA flag key


MODIS Subset Data (from the ORNL DAAC)
Red dots are the average of all pixels with acceptable quality (see landcover extract below for area covered).
Blue dots are the center pixel only (point is not plotted if the pixel is of unacceptable quality).


NDVI

The Normalized Difference Vegetation Index (NDVI) is the ratio of the  difference between visible (red) and infra-red (IR) wavebands to the sum of these bands. 

NDVI = nir - red / nir + red


 NDVI provides an indication of the amount and vigor of vegetated  surfaces. 

 NDVI has been widely used with multiple generations of satellite data.

EVI

 The Enhnaced Vegetation Index (EVI) is a more complicated combination of wavebands compared to the more widely used index, NDVI.  The advantage of this newer index is improved sensitivity in high biomass regions and reduction in atmospheric influences.
where,
pNIR = NIR reflectance
pRed = red reflectance
pBlue = blue reflectance
C1 = atmosphere resistance red correction coefficient
C2 = atmosphere resistance blue correction coefficient
L = canopy background brightness
G = gain factor


The MODIS sensor on the Terra satellite platform provides us with 16-day composite measures of NDVI/EVI throughout the year.  NASA distributes MODIS data from many of their distributed data centers.

MODIS Land Cover

MODIS Data Subset Citation:
Oak Ridge National Laboratory Distributed Active Archive Center (ORNL DAAC). 2007. MODIS subsetted land products, Collection 4. Available on-line [http://www.daac.ornl.gov/MODIS/modis.html] from ORNL DAAC, Oak Ridge, Tennessee, U.S.A..


FirstGov logo + Privacy Policy and Important Notices NASA Curator: Jaime Nickeson
NASA Official: Sadashiva Devadiga
Last Updated: February 1, 2024