| Great Falls, VA |
| Return to Regional/National map |
| County: Fairfax |
State: VA |
|
| Active Since: 2007 |
Observer: Manners |
| Lat/Long: 39.0, -77.3 |
Landsat WRS Path/Row: 15/33 |
| MODIS TIle V/H: 5/11 |
MODIS Line, Samp: 118.34, 1193.95 |
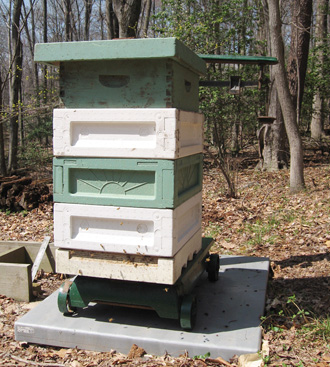
Site/Hive Description:
Hive is located in suburban Fairfax County. Area is about 2 miles from Potomac River. Mostly woodland close to river, pasture further west toward village. Woods are mixed hardwoods. dogwood, spicebush, greenbrier, honeysuckle, other shrubs and vines in understory, with some redbud at margins. Deer overpopulation is decimating understory and creating park-like open woods. Small streams and springs occur in woods.
Main flow is tulip tree (Liriodendron tulipifera) around second week of May for last 3 years, preceded and sometimes overlapping with black locust (Robinia pseudoacacia). Also have wild cherry, tupelo (Nyssa sylvatica), American holly, viburnums, raspberries, and blueberries, but not in enough quantity for large nectar flows. Early pollen is red maple, plus weeds like chickweed and dead nettle.
Hive has an Italian queen.
Scale is old (but newly painted with Rustoleum), Fairbanks 1000 lb. capacity, 0.5 increments, leveled on plastic base, exposed to weather; has weight pan and 2 weights to measure up to 400 lbs.
|
|
|
|
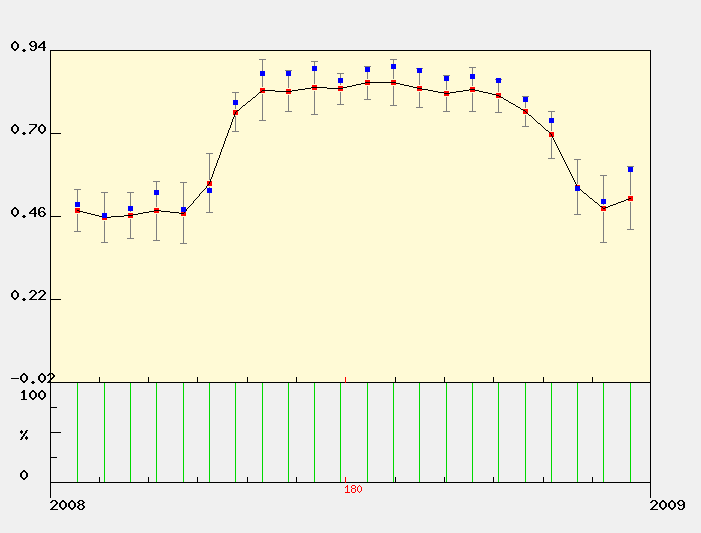
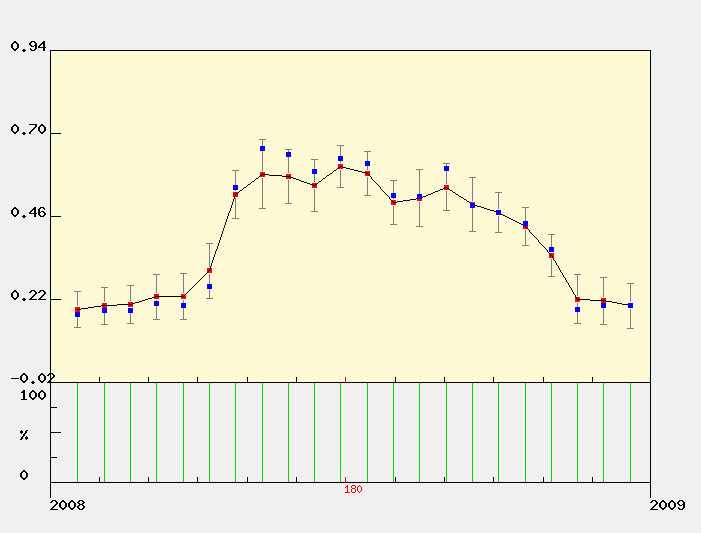
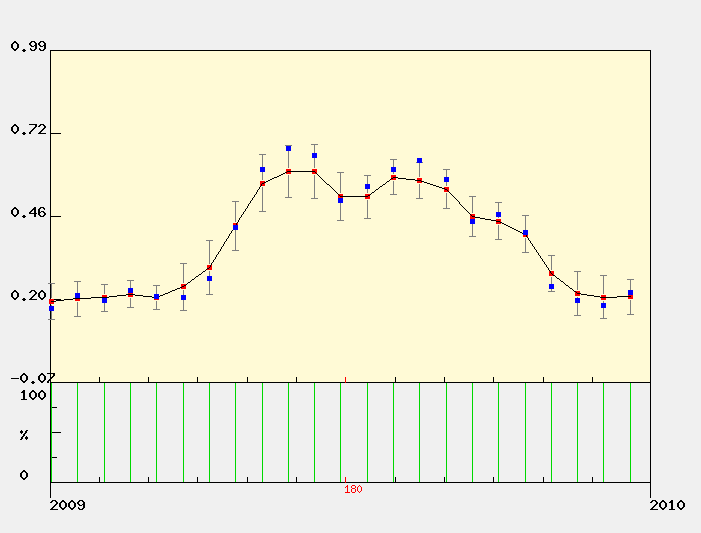
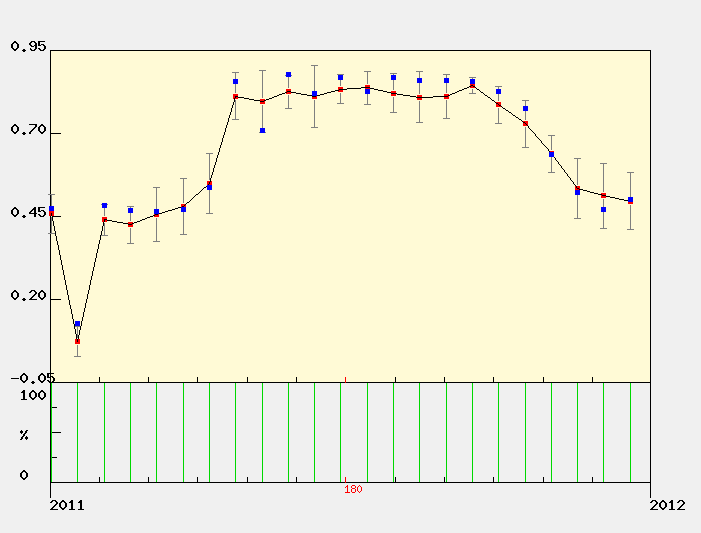
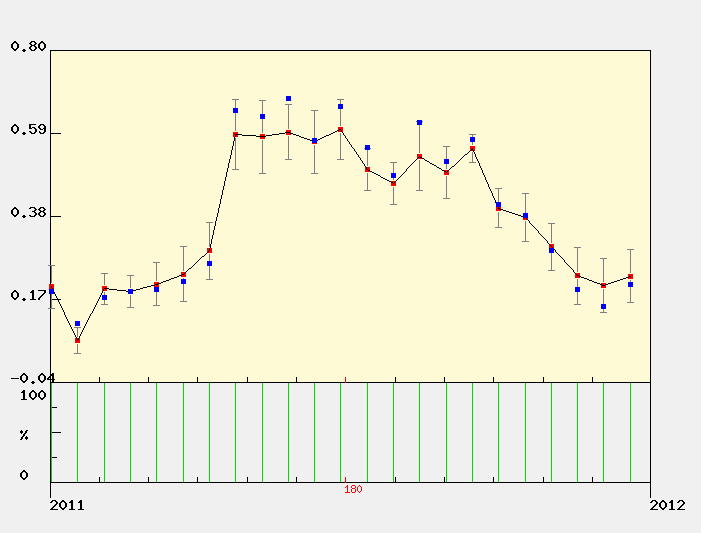
MODIS Subset Data (from the ORNL DAAC)
Red dots are the average of all pixels with acceptable quality (see landcover extract below for area covered).
Blue dots are the center pixel only (point is not plotted if the pixel is of unacceptable quality). |
| | | | | |
| NDVI The Normalized Difference Vegetation Index (NDVI) is the ratio of the difference between visible (red) and infra-red (IR) wavebands to the sum of these bands.
NDVI = nir - red / nir + red
NDVI provides an indication of the amount and vigor of vegetated surfaces.
NDVI has been widely used with multiple generations of satellite data.
|
 |
EVI
The Enhnaced Vegetation Index (EVI) is a more complicated combination of wavebands compared to the more widely used index, NDVI. The advantage of this newer index is improved sensitivity in high biomass regions and reduction in atmospheric influences.

where,
pNIR = NIR reflectance
pRed = red reflectance
pBlue = blue reflectance
C1 = atmosphere resistance red correction coefficient
C2 = atmosphere resistance blue correction coefficient
L = canopy background brightness
G = gain factor
|
|
The MODIS sensor on the Terra satellite platform provides us with 16-day composite measures of NDVI/EVI throughout the year. NASA distributes MODIS data from many of their distributed data centers.
|
|
|
|
MODIS Land Cover
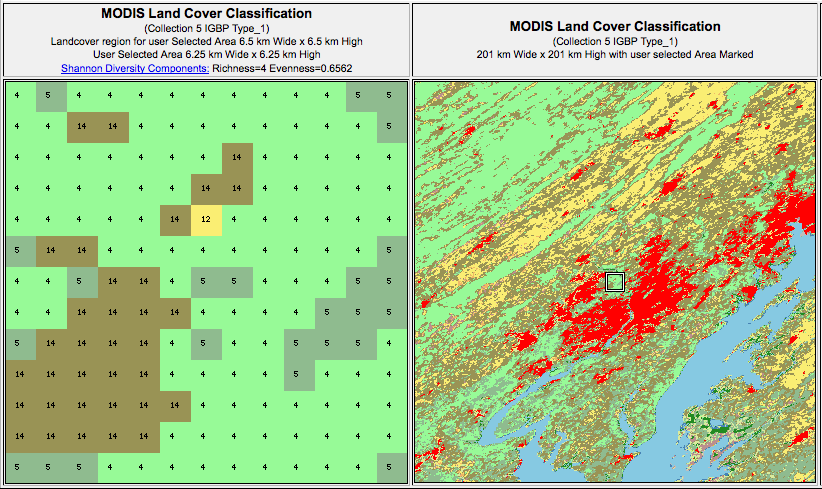

MODIS Data Subset Citation:
Oak Ridge National Laboratory Distributed Active Archive Center (ORNL DAAC). 2007. MODIS subsetted land products, Collection 4. Available on-line [http://www.daac.ornl.gov/MODIS/modis.html] from ORNL DAAC, Oak Ridge, Tennessee, U.S.A.. |
|
| |
| |
|