| Keiser, AR |
| Return to Regional/National map |
| County: Mississippi |
State: AR |
|
| Active Since: 1963 |
Observer: Warren |
| Lat/Long: 35.6, -90.1 |
Landsat WRS Path/Row: 23/35 |
| MODIS TIle V/H: 5/10 |
MODIS Line, Samp: 518.47, 817.84 |
Site/Hive Description:
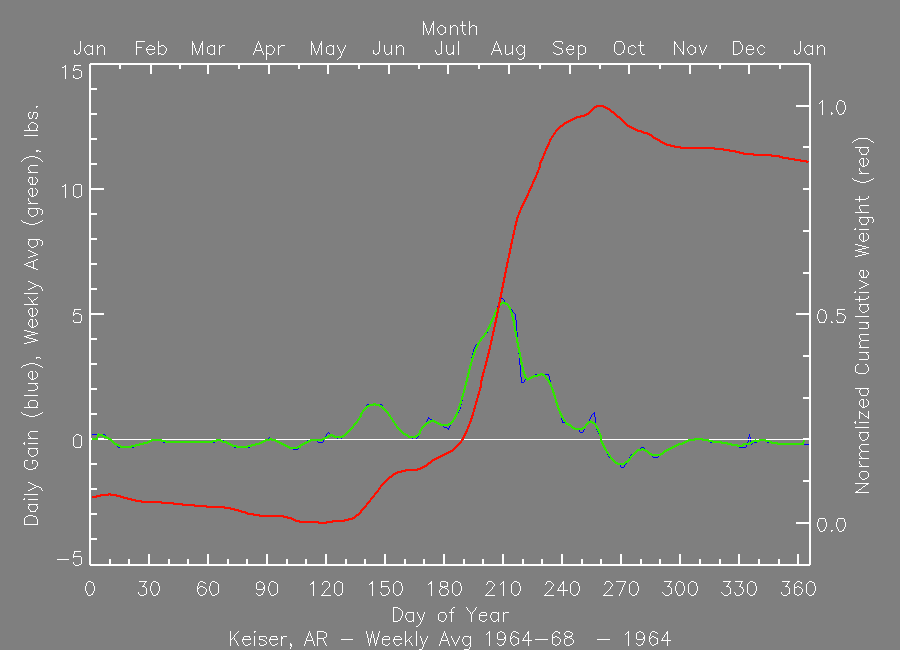
Site was the location of an apiary yard at the Northeast Branch Station, AR Dept. of Agriculture. Located among cropland on the Mississippi River floodplain when cotton acreage was transitioning to soybeans. Main nectar flow from these crops was in Jul/Aug.
Avg. of 4-13 hives/yr/ for 5 yrs, weekly values. Data here were extracted from small plot of the grand average. No error bars. Data were taken weekly or calculated to 7-day interval. Scale:
Howe 8320, leveled on wood or concrete, bottom board bolted to scale. Warren, Lloyd O. 1983 Seasonal flow pattern for honey production in Northeast Arkansas. Arkansas Farm Research 32: 8.
|
|
|
|
MODIS Subset Data (from the ORNL DAAC)
Red dots are the average of all pixels with acceptable quality (see landcover extract below for area covered).
Blue dots are the center pixel only (point is not plotted if the pixel is of unacceptable quality). |
| |
| NDVI The Normalized Difference Vegetation Index (NDVI) is the ratio of the difference between visible (red) and infra-red (IR) wavebands to the sum of these bands.
NDVI = nir - red / nir + red
NDVI provides an indication of the amount and vigor of vegetated surfaces.
NDVI has been widely used with multiple generations of satellite data.
|
 |
EVI
The Enhnaced Vegetation Index (EVI) is a more complicated combination of wavebands compared to the more widely used index, NDVI. The advantage of this newer index is improved sensitivity in high biomass regions and reduction in atmospheric influences.

where,
pNIR = NIR reflectance
pRed = red reflectance
pBlue = blue reflectance
C1 = atmosphere resistance red correction coefficient
C2 = atmosphere resistance blue correction coefficient
L = canopy background brightness
G = gain factor
|
|
The MODIS sensor on the Terra satellite platform provides us with 16-day composite measures of NDVI/EVI throughout the year. NASA distributes MODIS data from many of their distributed data centers.
|
|
|
|
MODIS Land Cover
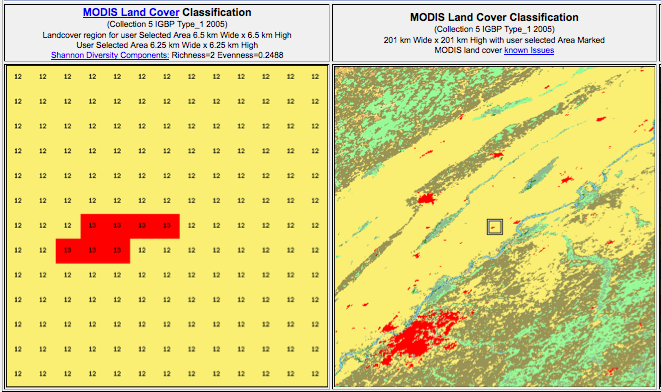

MODIS Data Subset Citation:
Oak Ridge National Laboratory Distributed Active Archive Center (ORNL DAAC). 2007. MODIS subsetted land products, Collection 4. Available on-line [http://www.daac.ornl.gov/MODIS/modis.html] from ORNL DAAC, Oak Ridge, Tennessee, U.S.A.. |
|
| |
| |
|