Skip all navigation and jump to content Jump to site navigation Jump to section navigation.
nasa meatball GSFC
NASA Logo - Goddard Space Flight Center + Visit NASA.gov
HoneyBeeNet banner image
ABOUT SCALE HIVES HONEYBEES SITE DATA NEWS LINKS
Utica, KY
Return to Regional/National map
County:  Daviess State: KY
Active Since: 2008 Observer: Mark
Lat/Long: 37.7, -87.1 Landsat WRS Path/Row: 21/34
MODIS TIle V/H: 5/11 MODIS Line, Samp: 277.50, 131.33

Site/Hive Description:

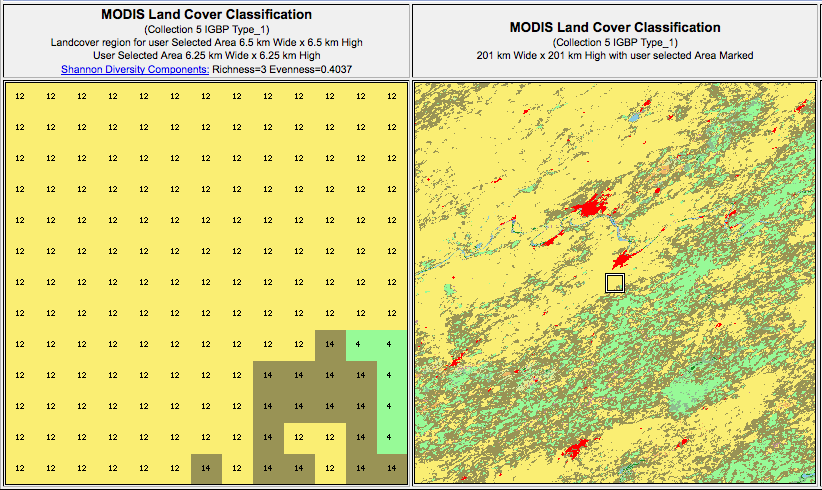
The hive has a southern exposure in full sun near a lake and is part of an apiary with 10-15 hives. There is flat cropland all around the hive site. The cropland is surrounded by woods with oaks, red maple, catalpa, tulip poplar, pines, hickory, pecans, hicans (the native Burton Hican), persimmon, willow, beech, birch honey locust, black locust.

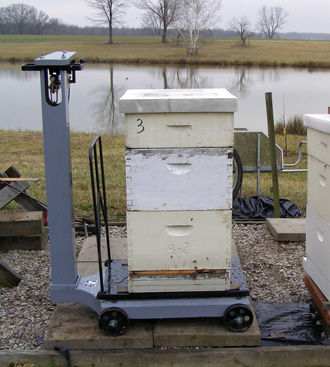
The scale is a chinese version of the old feed mill scale. The scale is exposed to the weather and the moving parts are covered with a customer box for protection. The scale can read to the nearest 100grams or equivalent to that measure. The scale is level and sitting on 4 concrete pavers 16”x16”

The hive is number 4-2, has a carniolan queen from July 2007. It was two brood boxes of 10 frames and one honey super with 9 frames. It is quite strong and has almost one full brood and honey super full of honey. The initial weight is 69.4 Kg.

The big honey flows of spring are mostly tulip poplar and black locust. There are also black berry thickets as well as catalpa later in the spring. Most of the time tulip poplar and locust bloom very close together.


Nectar Flow Data 2008

Download Data File (comma delimited), download QA flag key


Nectar Flow Data 2009

Download Data File (comma delimited), download QA flag key


Nectar Flow Data 2011

Download Data File (comma delimited), download QA flag key


MODIS Subset Data (from the ORNL DAAC)
Red dots are the average of all pixels with acceptable quality (see landcover extract below for area covered).
Blue dots are the center pixel only (point is not plotted if the pixel is of unacceptable quality).


NDVI

The Normalized Difference Vegetation Index (NDVI) is the ratio of the  difference between visible (red) and infra-red (IR) wavebands to the sum of these bands. 

NDVI = nir - red / nir + red


 NDVI provides an indication of the amount and vigor of vegetated  surfaces. 

 NDVI has been widely used with multiple generations of satellite data.

EVI

 The Enhnaced Vegetation Index (EVI) is a more complicated combination of wavebands compared to the more widely used index, NDVI.  The advantage of this newer index is improved sensitivity in high biomass regions and reduction in atmospheric influences.
where,
pNIR = NIR reflectance
pRed = red reflectance
pBlue = blue reflectance
C1 = atmosphere resistance red correction coefficient
C2 = atmosphere resistance blue correction coefficient
L = canopy background brightness
G = gain factor


The MODIS sensor on the Terra satellite platform provides us with 16-day composite measures of NDVI/EVI throughout the year.  NASA distributes MODIS data from many of their distributed data centers.

MODIS Land Cover

MODIS Data Subset Citation:
Oak Ridge National Laboratory Distributed Active Archive Center (ORNL DAAC). 2007. MODIS subsetted land products, Collection 4. Available on-line [http://www.daac.ornl.gov/MODIS/modis.html] from ORNL DAAC, Oak Ridge, Tennessee, U.S.A..


FirstGov logo + Privacy Policy and Important Notices NASA Curator: Jaime Nickeson
NASA Official: Sadashiva Devadiga
Last Updated: February 1, 2024