| Wellfleet, MA |
| Return to Regional/National map |
| County: Barnstable |
State: MA |
|
| Active Since: 2001 |
Observer: Portnoy |
| Lat/Long: 41.9, 70.0 |
Landsat WRS Path/Row: 12/31 |
| MODIS TIle V/H: 4/12 |
MODIS Line, Samp: 965.12, 950.63 |
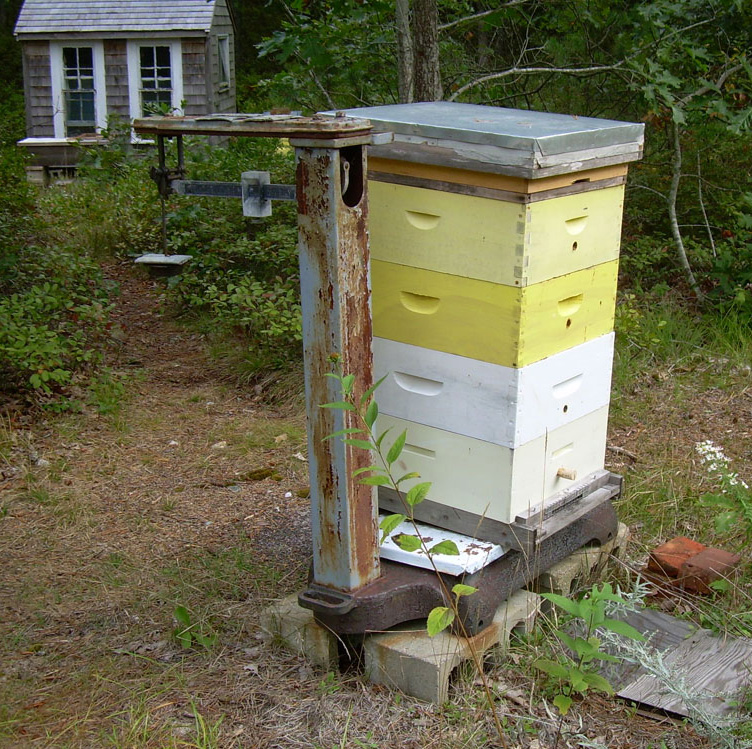
Site/Hive Description:
Hive located on the Lower Cape adjacent to Cape Cod National Seashore. Surrounding vegetation is upland mixed pine-oak forest. The extended area consists of salt marshes and freshwater wetland shrubs and trees. Hive has a southern exposure, with about 8 hrs of full sun in summer. Colony:
Consists of four mediums, headed by home grown (about 4th generation) 2009 queen. Started breeding from Carniolans and Russians about seven years ago, no bees or queens have been purchased since. Scale:
500 lb capacity, unknown brand. .25 lb increments, leveled on concrete blocks, beam protected from weather. Forage:
Robinia pseudoacacia (black locust), mid-June; Ilex verticillata (Holly, common winterberry), late Jun-early Jul; Clethra alnifolia (Sweet Pepperbush), early August.
|
|
|
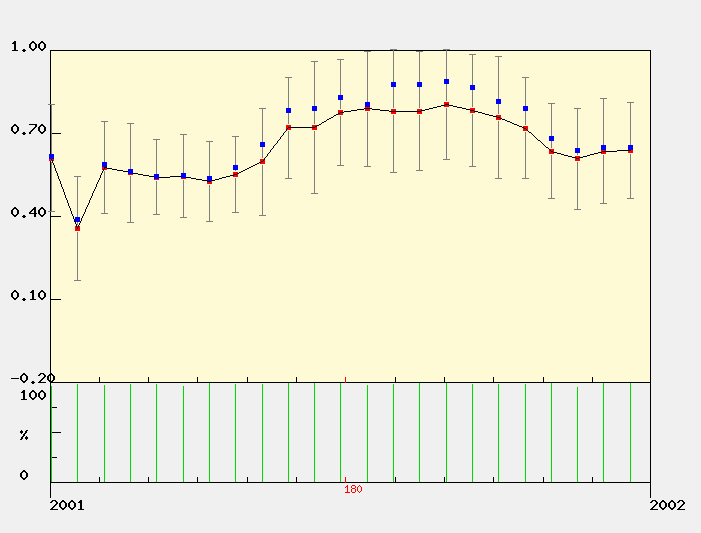
| Nectar Flow Data 2001 | Download Data File (comma delimited), download QA flag key 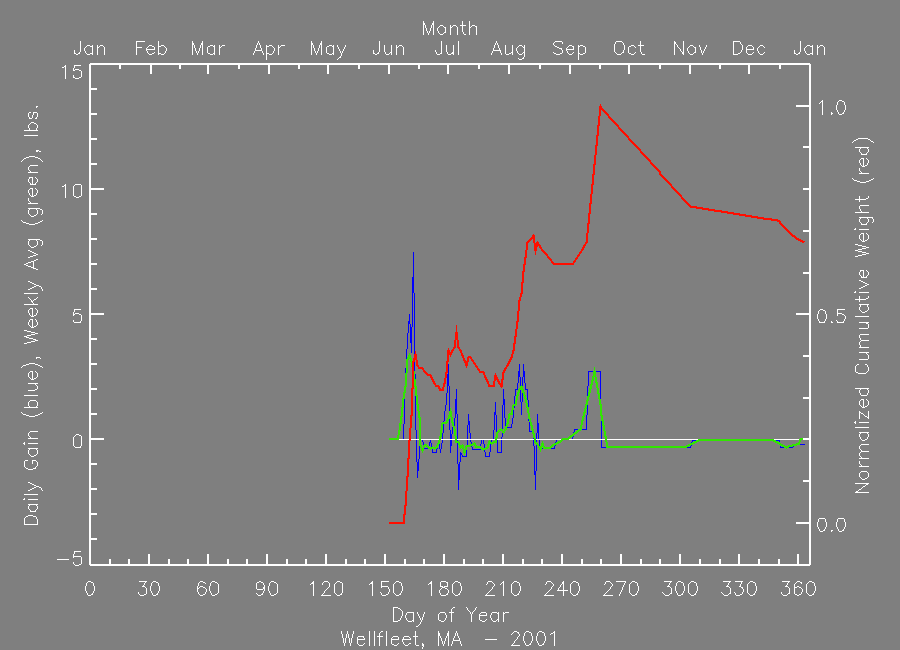
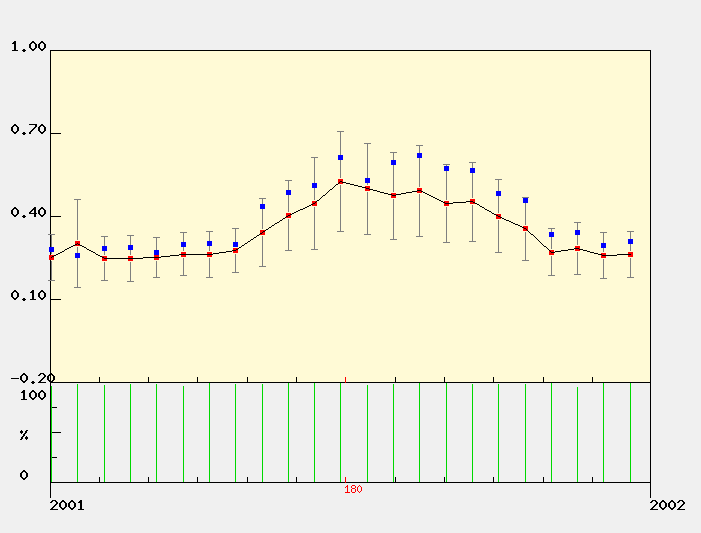
| | | Nectar Flow Data 2002 | Download Data File (comma delimited), download QA flag key 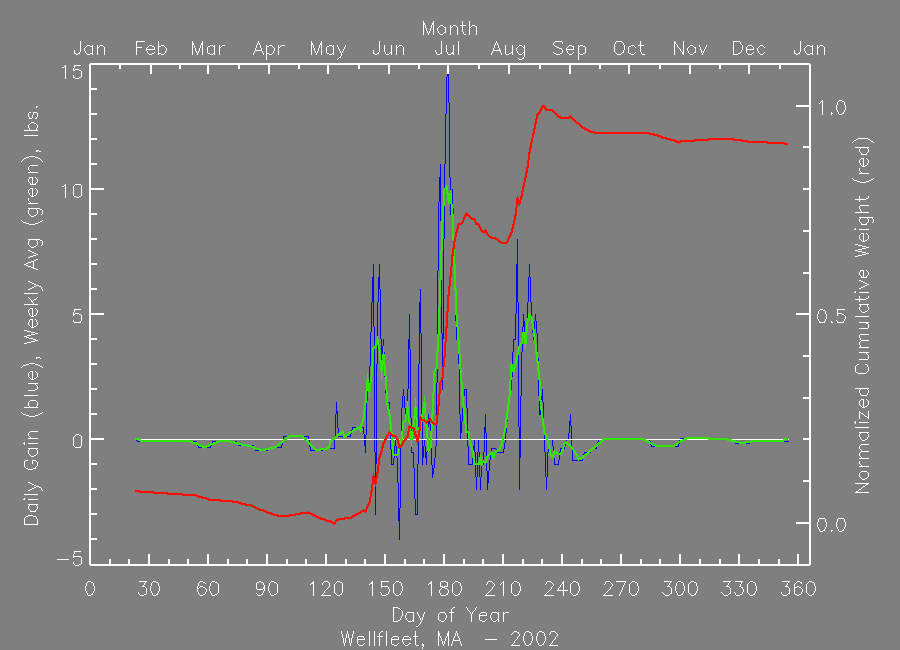
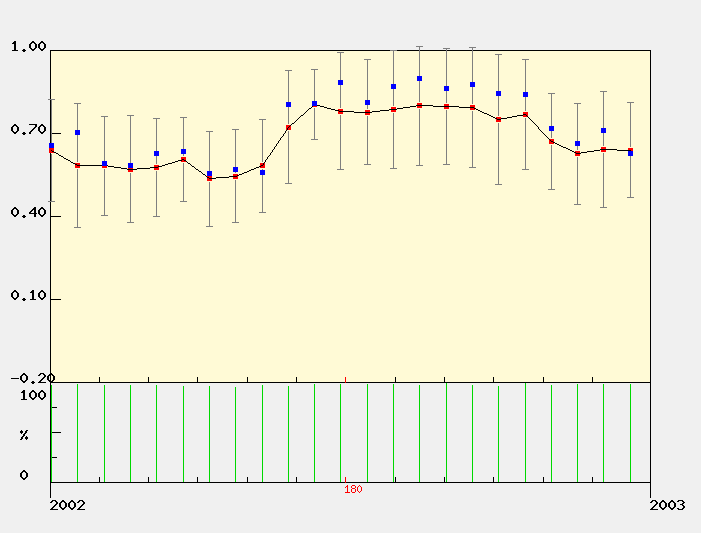
| | | Nectar Flow Data 2003 | Download Data File (comma delimited), download QA flag key 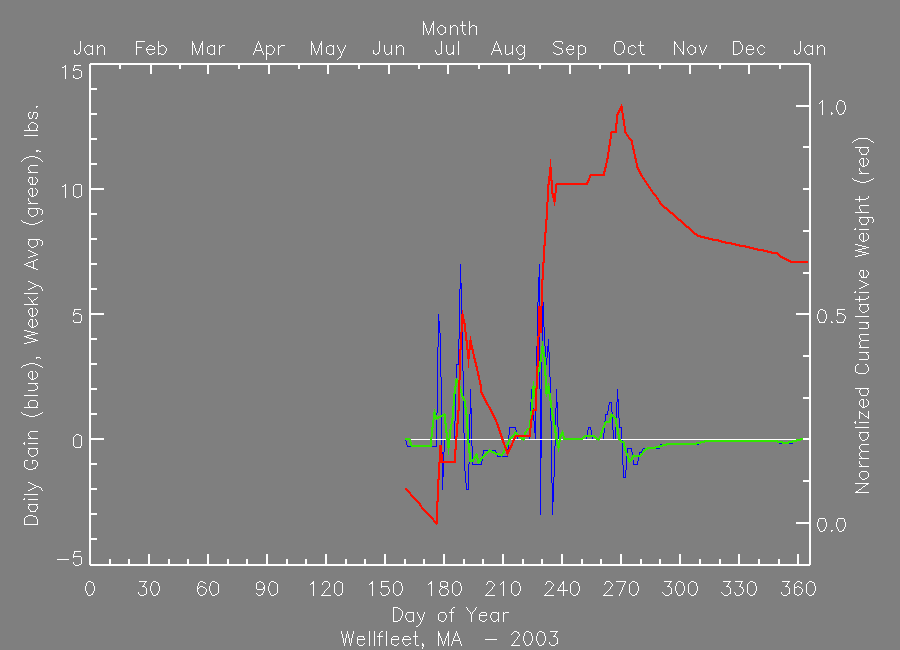
| | | Nectar Flow Data 2004 | Download Data File (comma delimited), download QA flag key 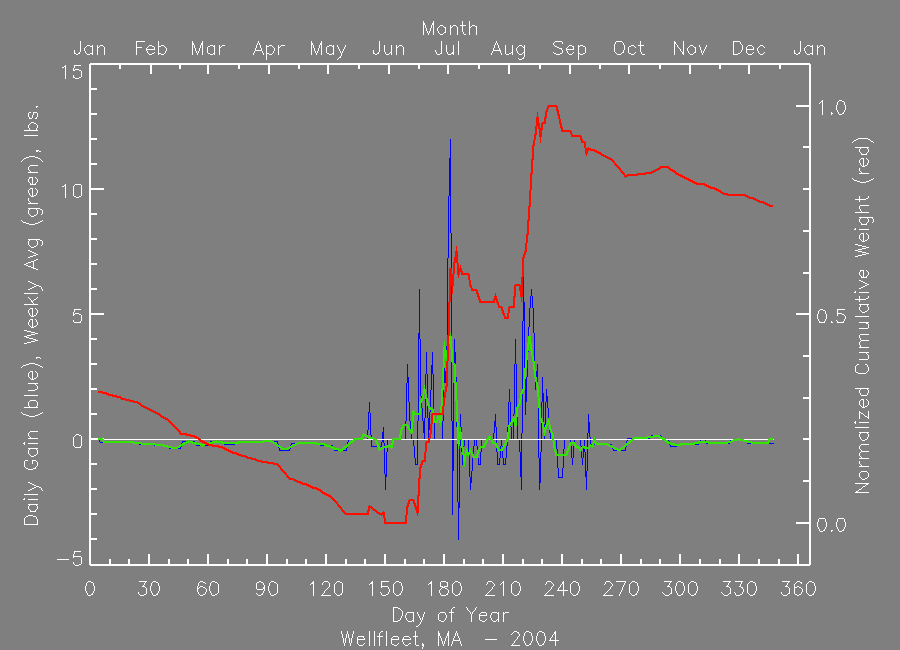
| | | Nectar Flow Data 2005 | Download Data File (comma delimited), download QA flag key 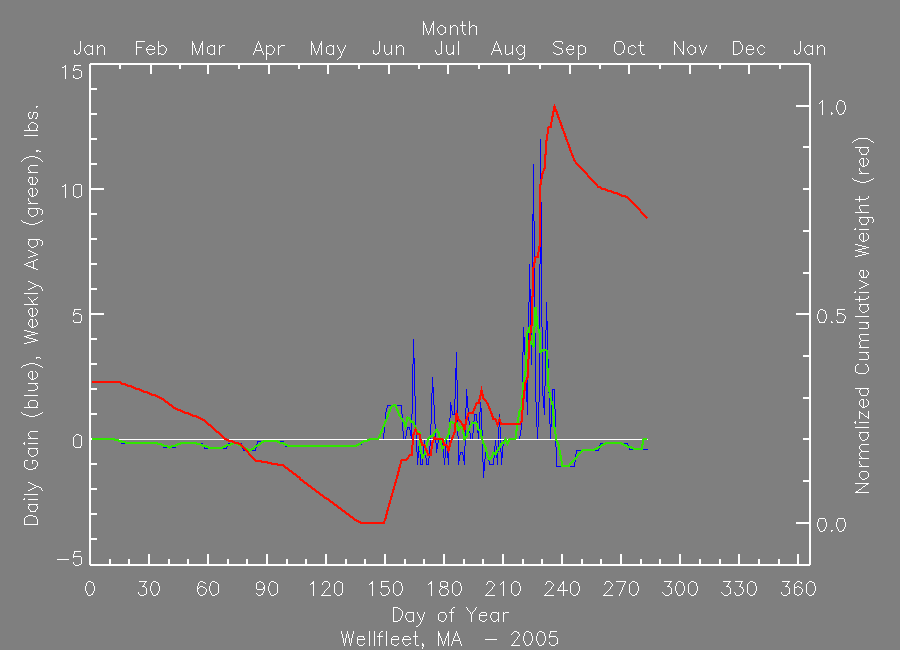
| | | Nectar Flow Data 2006 | Download Data File (comma delimited), download QA flag key 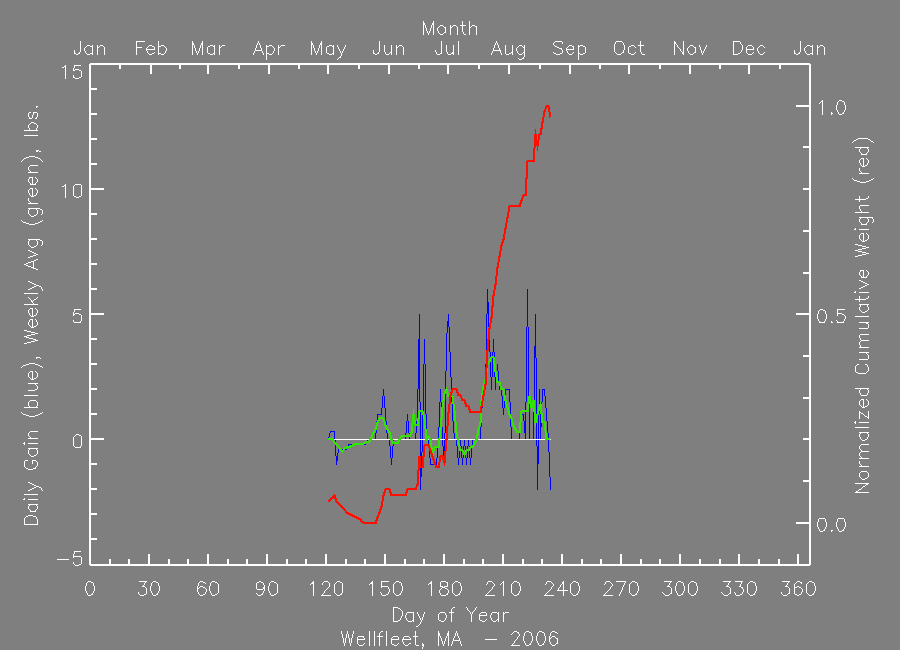
| | | Nectar Flow Data 2007 | Download Data File (comma delimited), download QA flag key 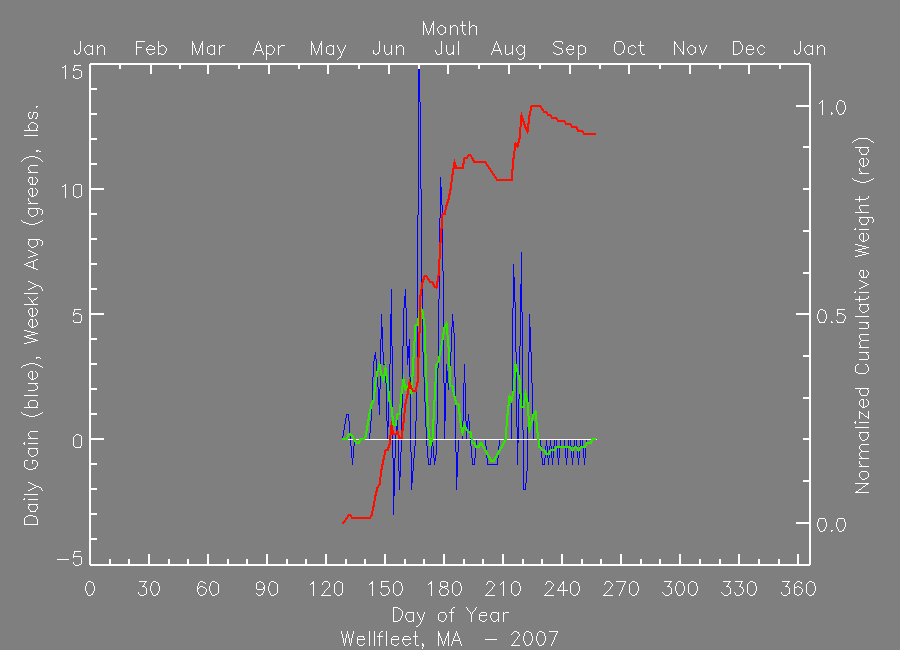
| | | Nectar Flow Data 2008 | Download Data File (comma delimited), download QA flag key 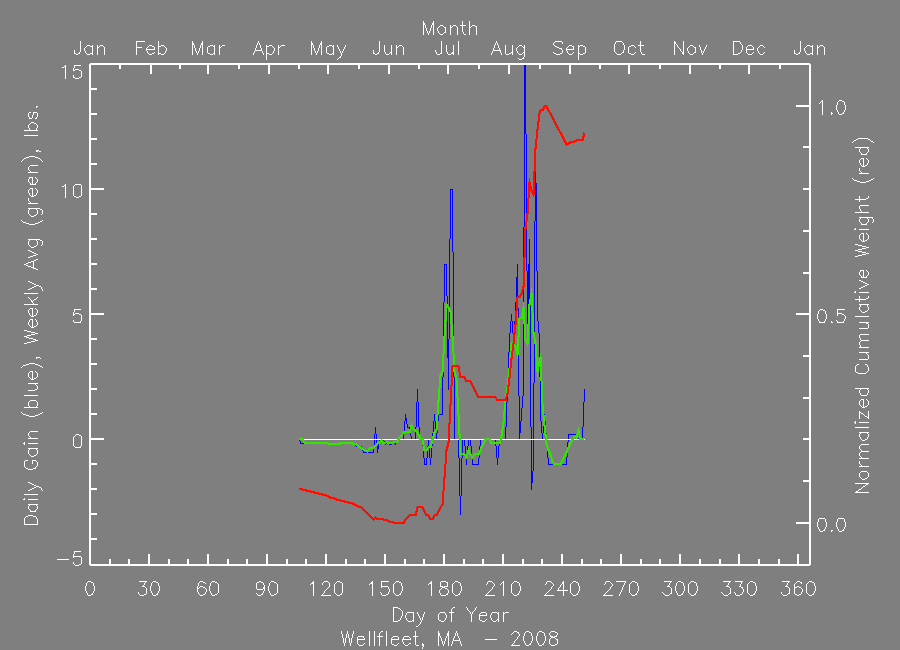
| | | Nectar Flow Data 2009 | Download Data File (comma delimited), download QA flag key 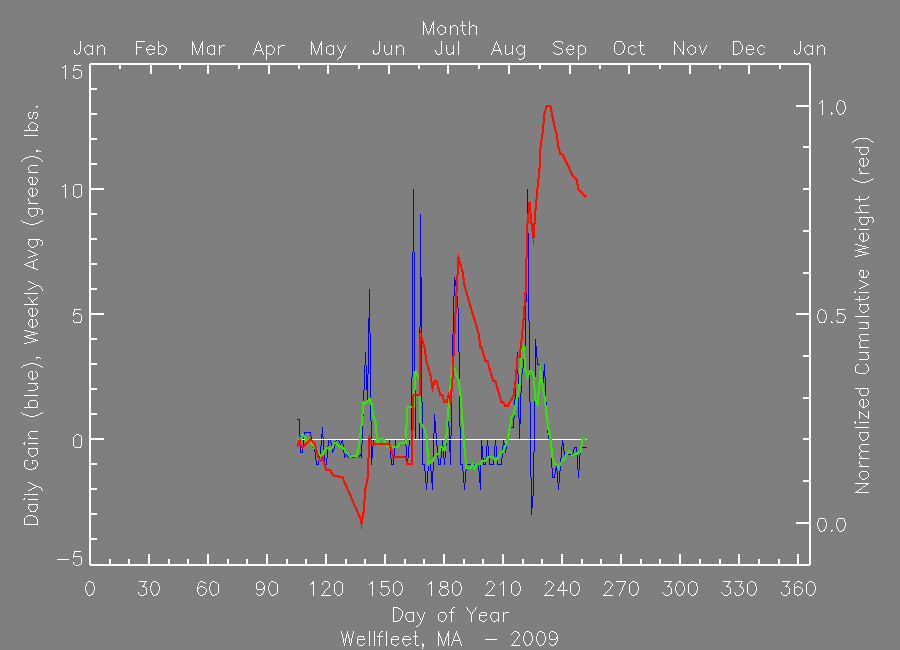
| | | Nectar Flow Data 2010 | Download Data File (comma delimited), download QA flag key 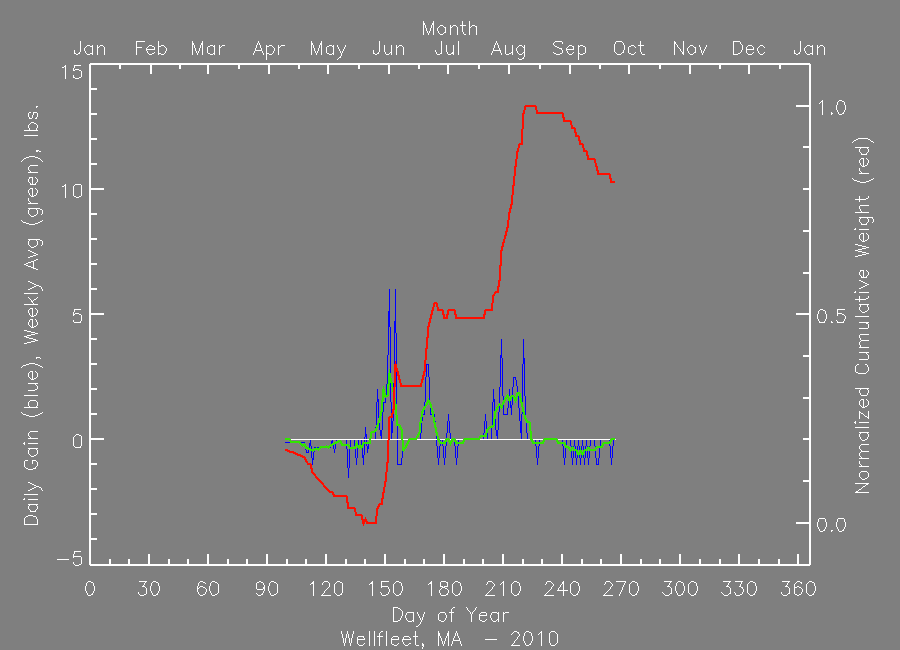
| | | Nectar Flow Data 2011 | Download Data File (comma delimited), download QA flag key 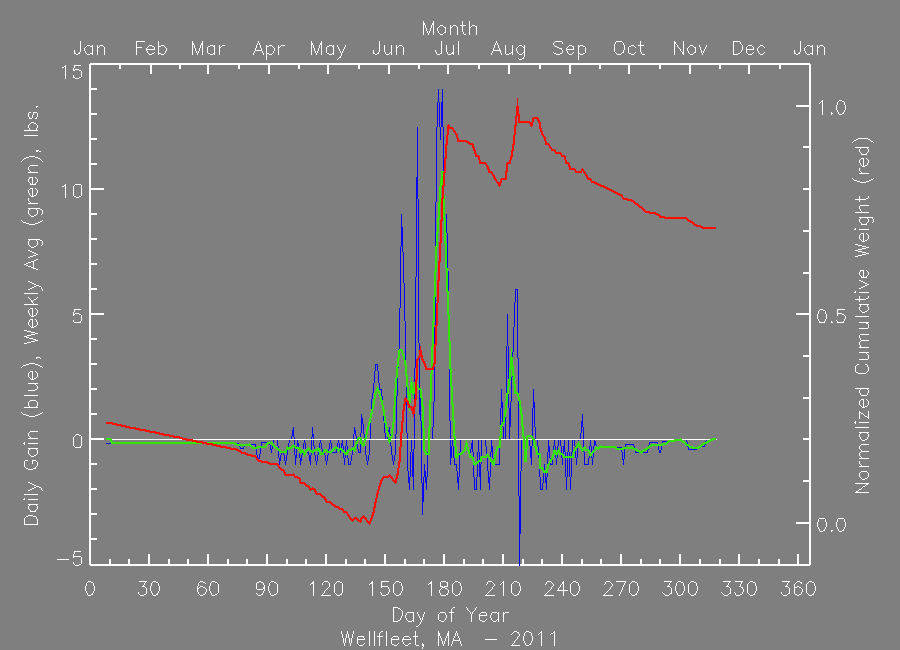
| | | Nectar Flow Data 2012 | Download Data File (comma delimited), download QA flag key 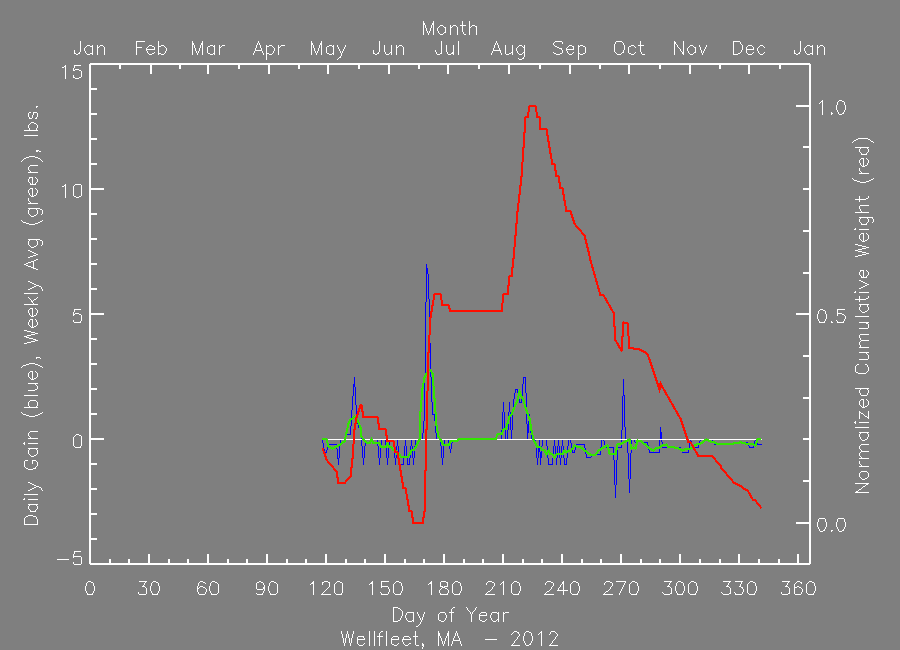
| |
|
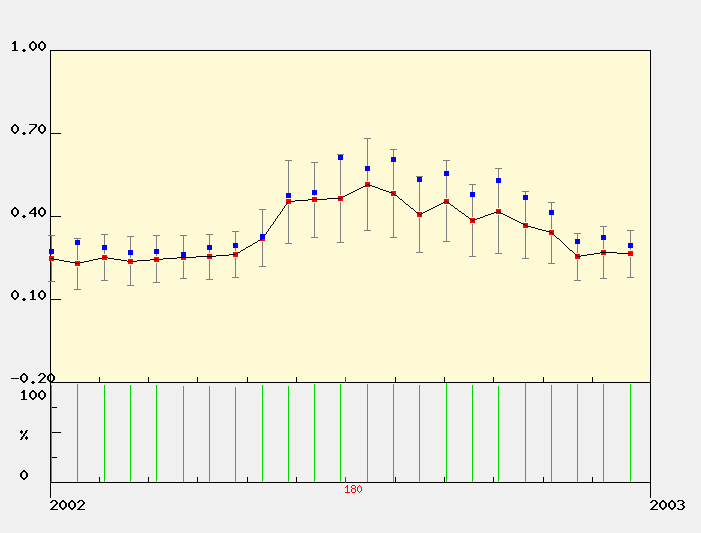
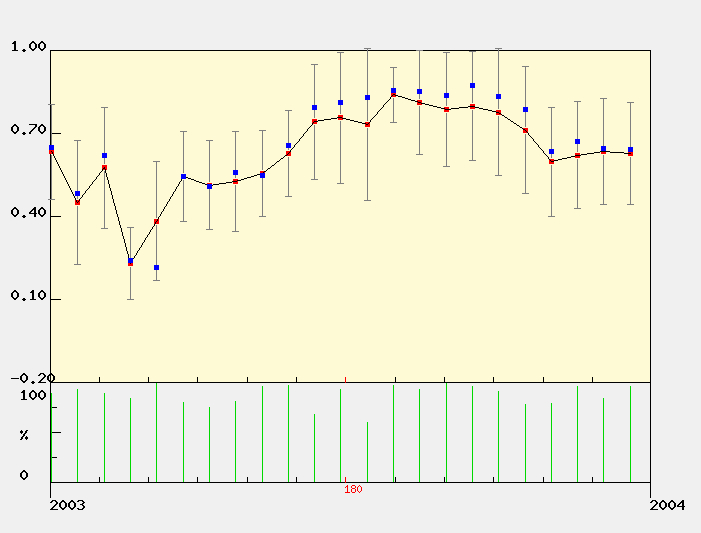
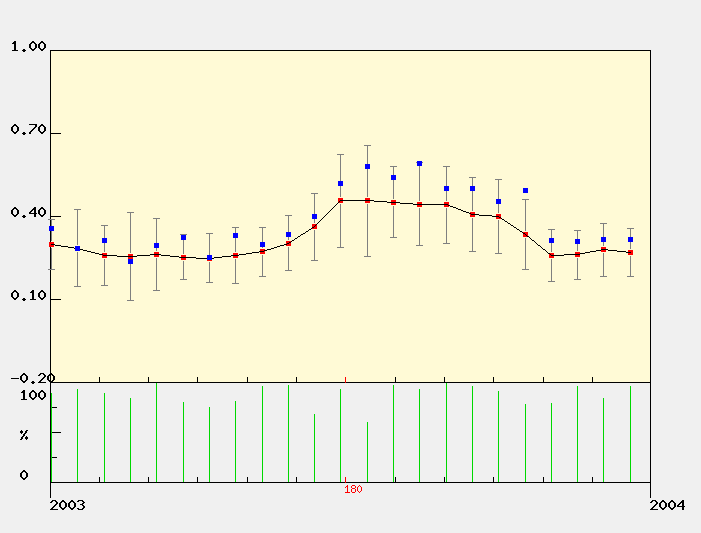
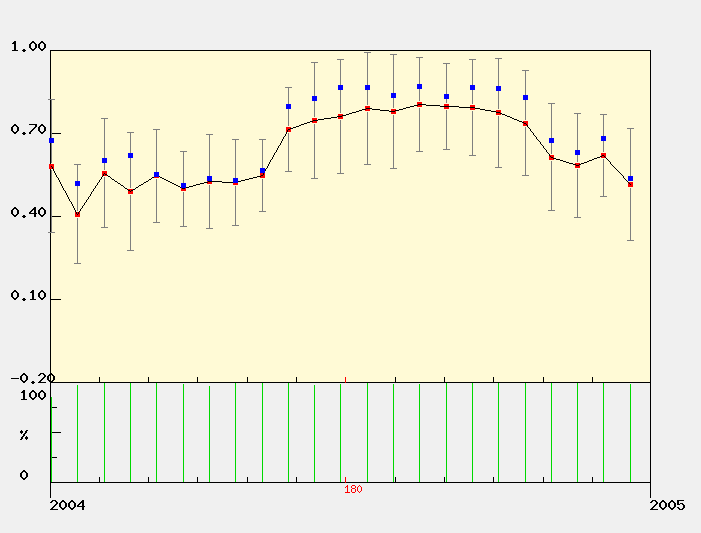
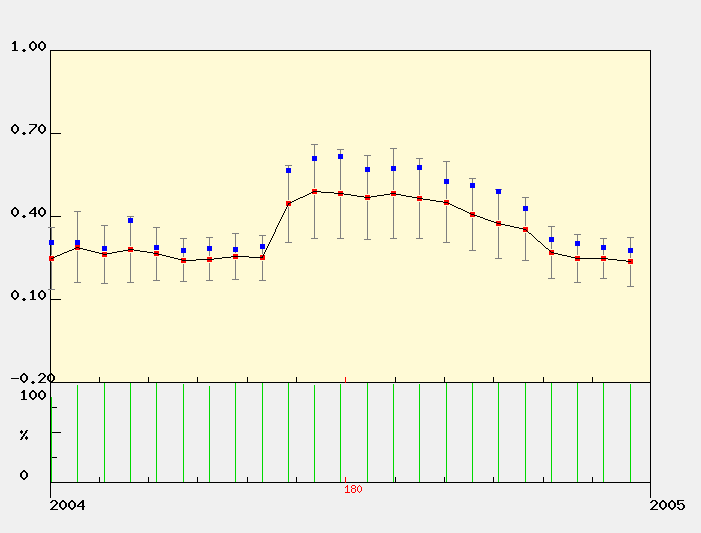
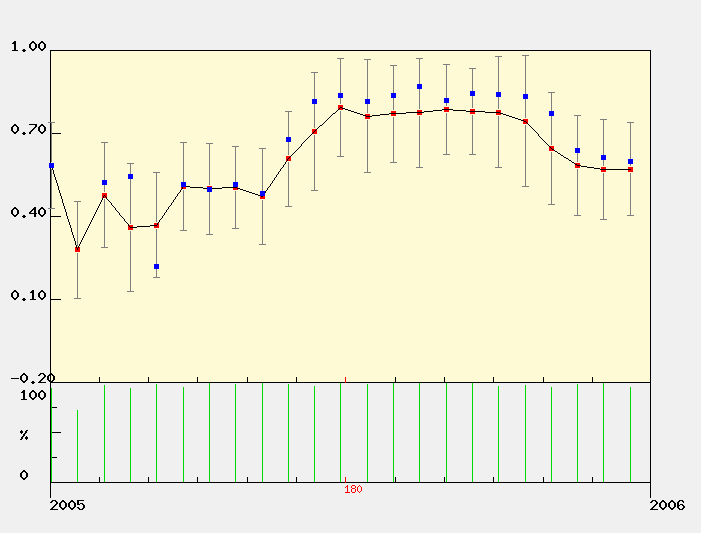
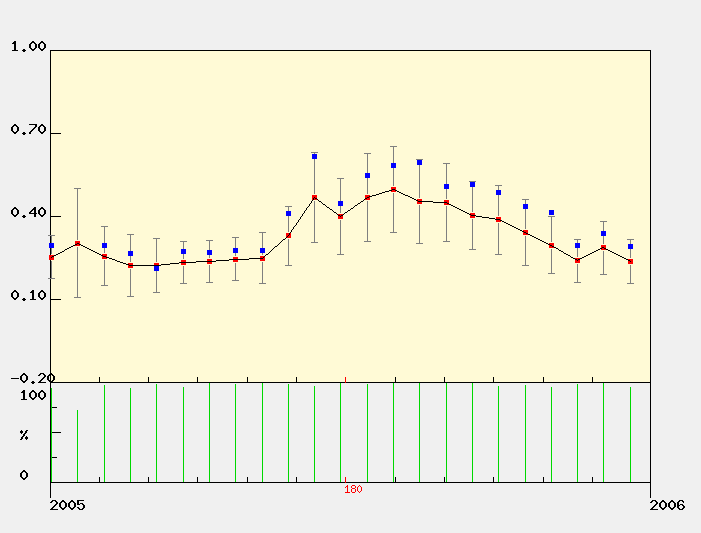
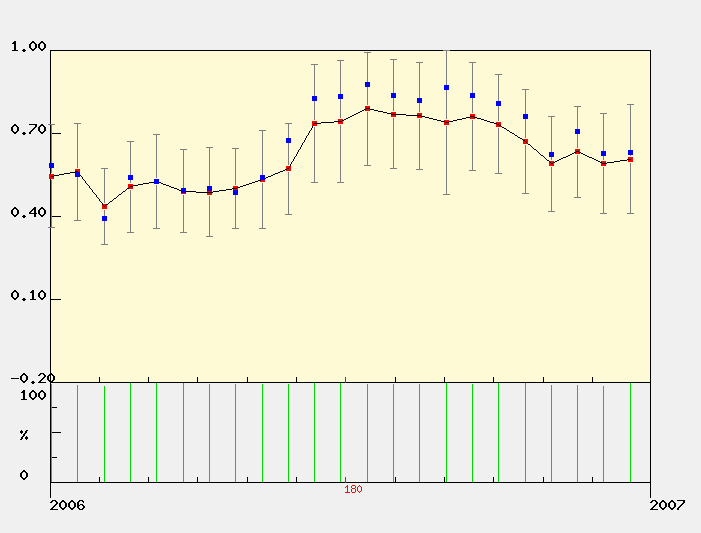
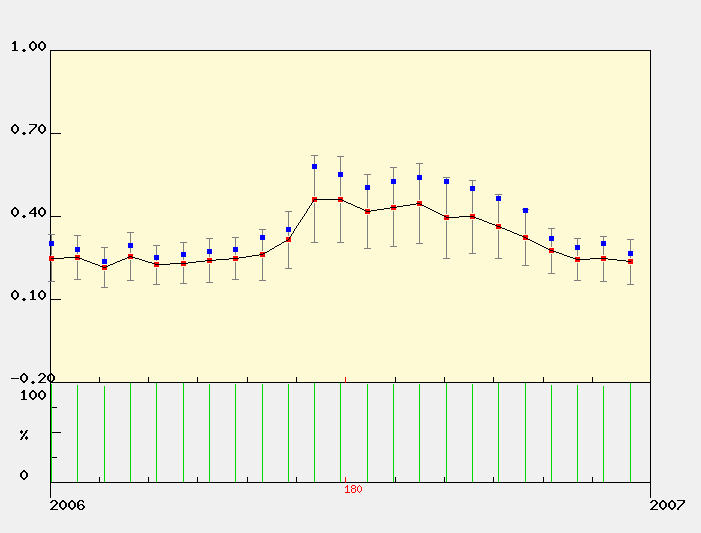
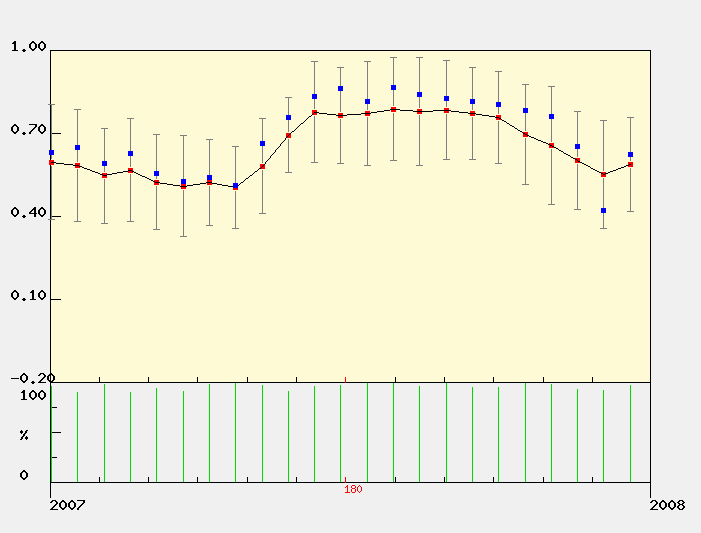
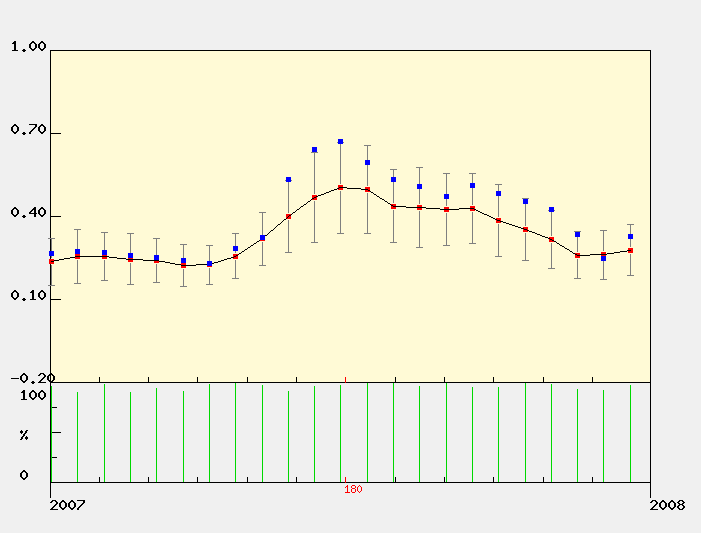
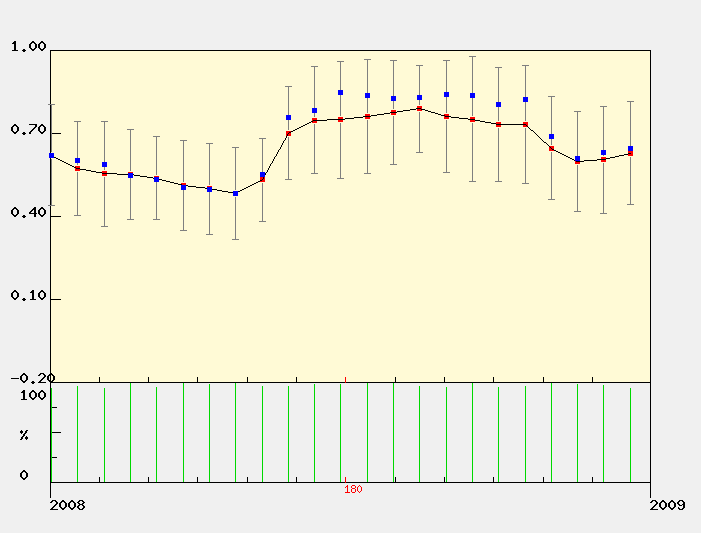
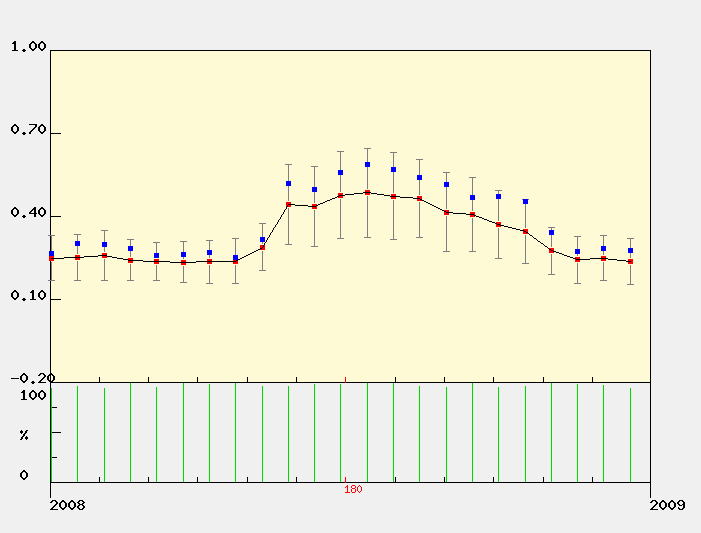
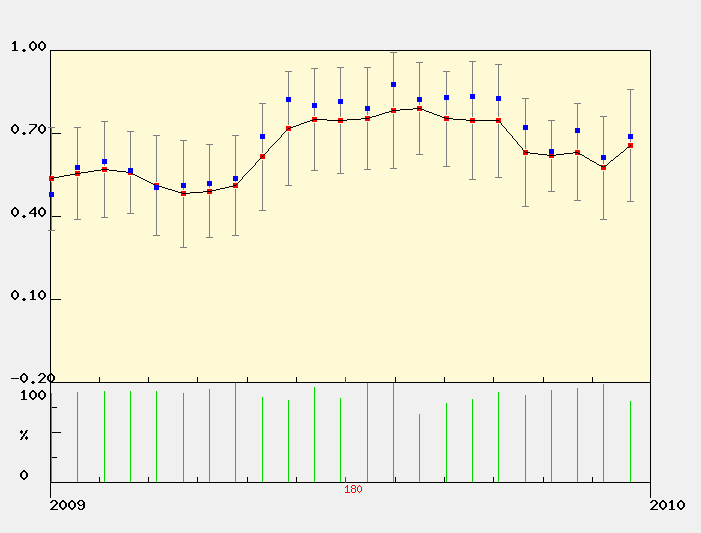
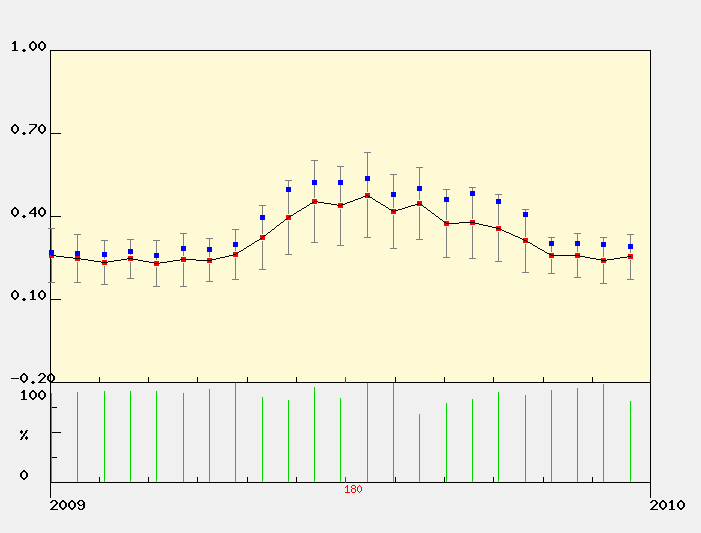
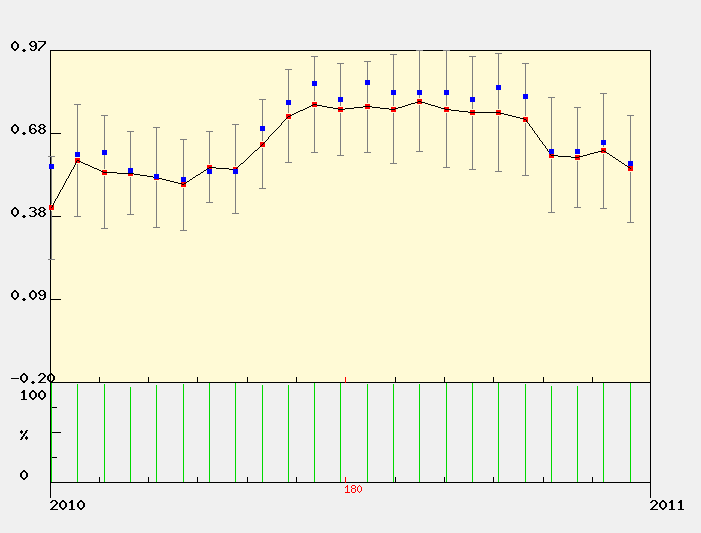
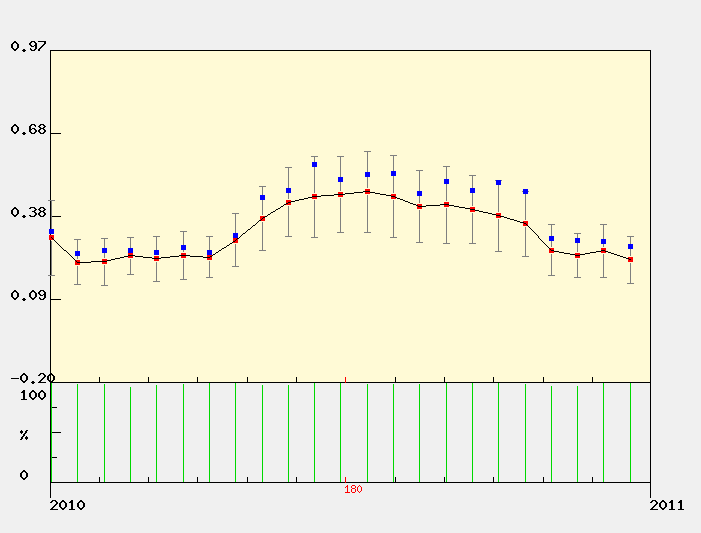
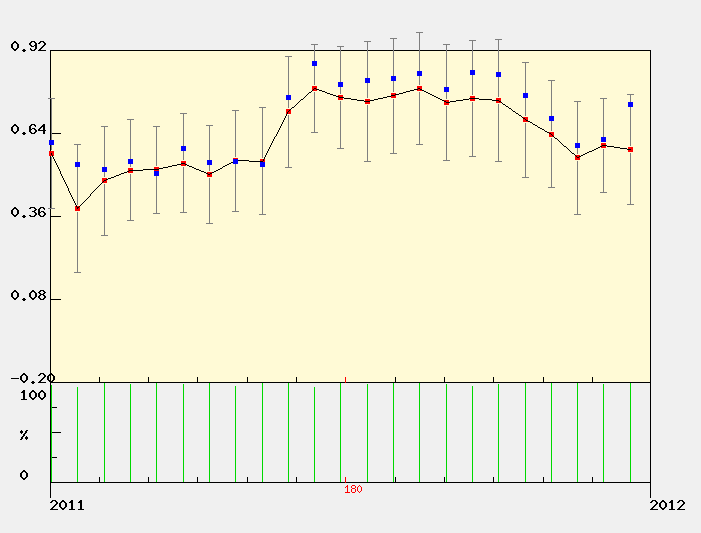
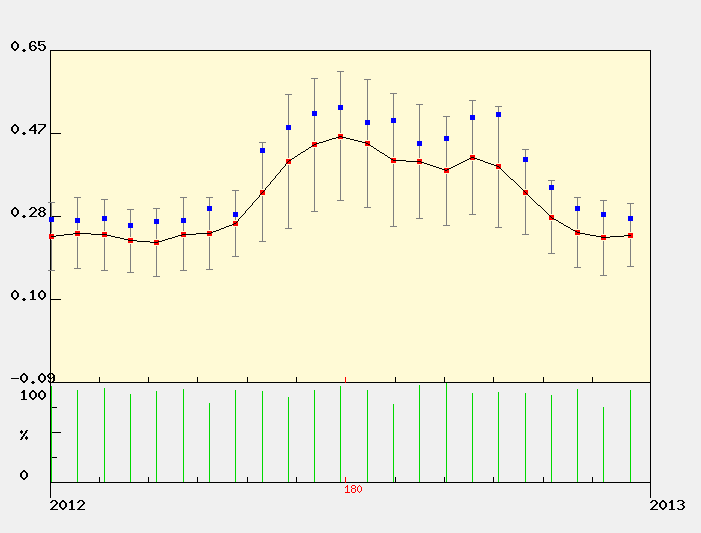
MODIS Subset Data (from the ORNL DAAC)
Red dots are the average of all pixels with acceptable quality (see landcover extract below for area covered).
Blue dots are the center pixel only (point is not plotted if the pixel is of unacceptable quality). |
| | | | | | | | | | | | | | | | | | | | | | | |
| NDVI The Normalized Difference Vegetation Index (NDVI) is the ratio of the difference between visible (red) and infra-red (IR) wavebands to the sum of these bands.
NDVI = nir - red / nir + red
NDVI provides an indication of the amount and vigor of vegetated surfaces.
NDVI has been widely used with multiple generations of satellite data.
|
 |
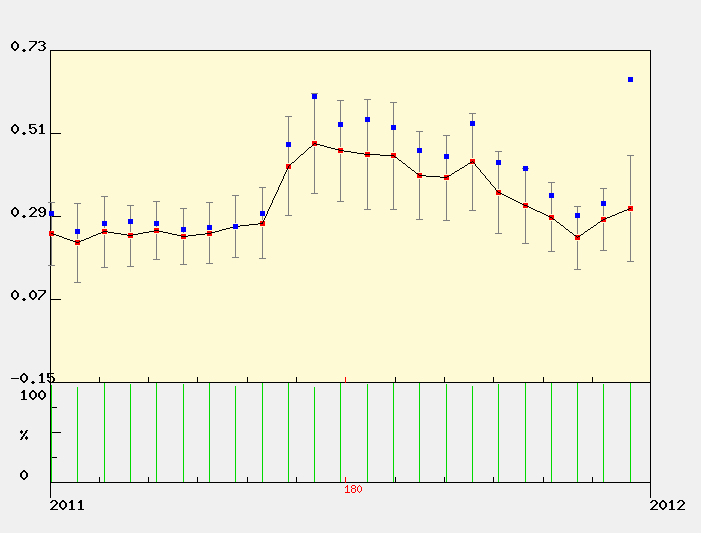
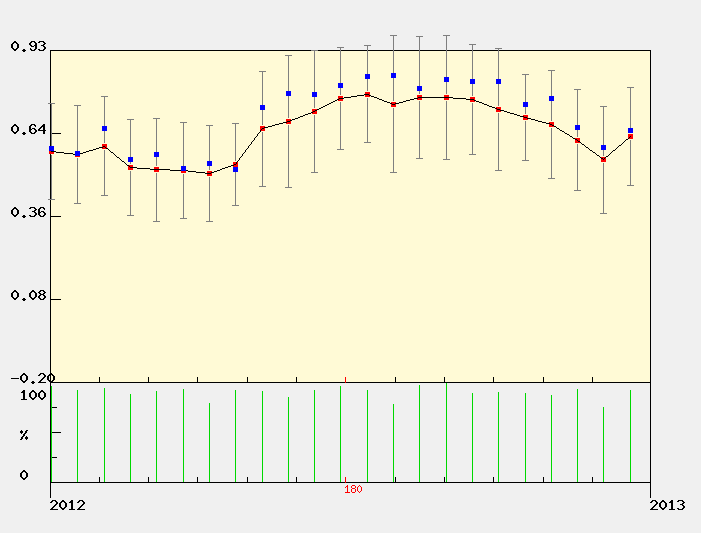
EVI
The Enhnaced Vegetation Index (EVI) is a more complicated combination of wavebands compared to the more widely used index, NDVI. The advantage of this newer index is improved sensitivity in high biomass regions and reduction in atmospheric influences.

where,
pNIR = NIR reflectance
pRed = red reflectance
pBlue = blue reflectance
C1 = atmosphere resistance red correction coefficient
C2 = atmosphere resistance blue correction coefficient
L = canopy background brightness
G = gain factor
|
|
The MODIS sensor on the Terra satellite platform provides us with 16-day composite measures of NDVI/EVI throughout the year. NASA distributes MODIS data from many of their distributed data centers.
|
|
|
|
MODIS Land Cover
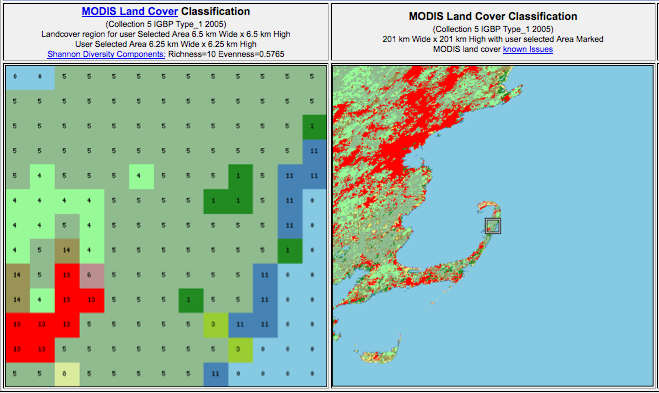

MODIS Data Subset Citation:
Oak Ridge National Laboratory Distributed Active Archive Center (ORNL DAAC). 2007. MODIS subsetted land products, Collection 4. Available on-line [http://www.daac.ornl.gov/MODIS/modis.html] from ORNL DAAC, Oak Ridge, Tennessee, U.S.A.. |
|
| |
| |
|