Skip all navigation and jump to content Jump to site navigation Jump to section navigation.
nasa meatball GSFC
NASA Logo - Goddard Space Flight Center + Visit NASA.gov
HoneyBeeNet banner image
ABOUT SCALE HIVES HONEYBEES SITE DATA NEWS LINKS
Keedysville, MD
Return to Regional/National map
County:  Washington State: MD
Active Since: 2012 Observer: Esaias
Lat/Long: 39.5, -77.7 Landsat WRS Path/Row: 0/0
MODIS TIle V/H: 0/0 MODIS Line, Samp: 0.00, 0.00

Site/Hive Description:

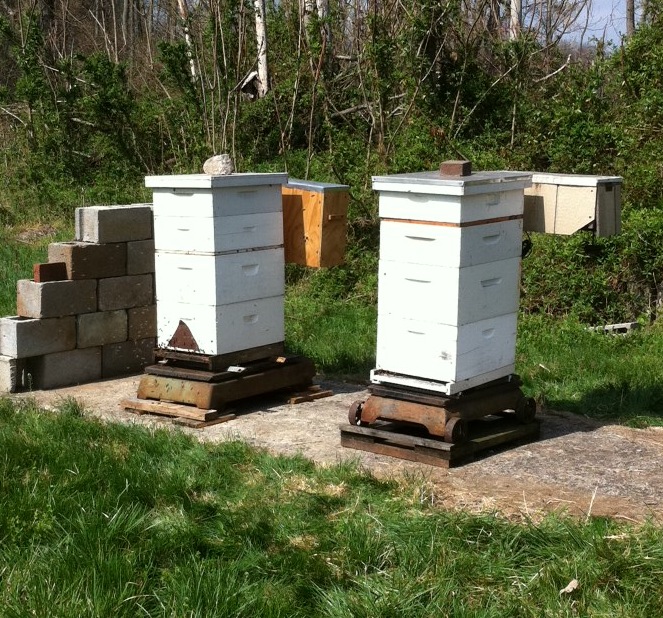
Two hives located in the UMD Western Md. Research and Education Center apiary in the Antietam Creek valley near Keedysville. Landscape is mixed cropland and woodland, with apple orchards. Apiary is sheltered by hedgerows and trees.

Colony:
Two deep 10-frame brood chambers, with excluder and medium supers. The bees are mixed stock with new queens from from a local breeder.

Scale:
A Fairbanks 500 lb (0.25 div) and Howe 1000 lb (0.5 div) both on concrete pad and equipped with NASA/USDA electronic scales. The beams are covered, hives open to the weather.

Forage:
Tulip poplar, black locust, berries, linden, some sweet clover and alfalfa, sumac, goldenrod, aster. Several acres of oilseed sunflower were planted nearby.


Nectar Flow Data 2012

Download Data File (comma delimited), download QA flag key


MODIS Subset Data (from the ORNL DAAC)
Red dots are the average of all pixels with acceptable quality (see landcover extract below for area covered).
Blue dots are the center pixel only (point is not plotted if the pixel is of unacceptable quality).


NDVI

The Normalized Difference Vegetation Index (NDVI) is the ratio of the  difference between visible (red) and infra-red (IR) wavebands to the sum of these bands. 

NDVI = nir - red / nir + red


 NDVI provides an indication of the amount and vigor of vegetated  surfaces. 

 NDVI has been widely used with multiple generations of satellite data.

EVI

 The Enhnaced Vegetation Index (EVI) is a more complicated combination of wavebands compared to the more widely used index, NDVI.  The advantage of this newer index is improved sensitivity in high biomass regions and reduction in atmospheric influences.
where,
pNIR = NIR reflectance
pRed = red reflectance
pBlue = blue reflectance
C1 = atmosphere resistance red correction coefficient
C2 = atmosphere resistance blue correction coefficient
L = canopy background brightness
G = gain factor


The MODIS sensor on the Terra satellite platform provides us with 16-day composite measures of NDVI/EVI throughout the year.  NASA distributes MODIS data from many of their distributed data centers.

MODIS Land Cover

MODIS Data Subset Citation:
Oak Ridge National Laboratory Distributed Active Archive Center (ORNL DAAC). 2007. MODIS subsetted land products, Collection 4. Available on-line [http://www.daac.ornl.gov/MODIS/modis.html] from ORNL DAAC, Oak Ridge, Tennessee, U.S.A..


FirstGov logo + Privacy Policy and Important Notices NASA Curator: Jaime Nickeson
NASA Official: Sadashiva Devadiga
Last Updated: February 1, 2024