| Mechanicsburg, PA |
| Return to Regional/National map |
| County: Cumberland |
State: PA |
|
| Active Since: 2011 |
Observer: Morgan |
| Lat/Long: 40.1, -77.1 |
Landsat WRS Path/Row: 15/32 |
| MODIS TIle V/H: 0/0 |
MODIS Line, Samp: 0.00, 0.00 |
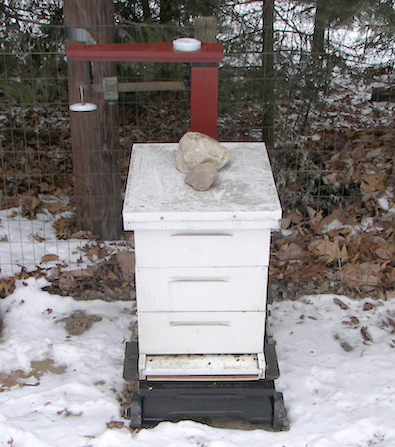
Site/Hive Description:
Site is located on the bottom of a small mountain with hundreds of wooded acres. The surrounding area is rural suburban with houses on large grassy lots. The hive is located in a mixed forested area surrounded by chestnut oaks and many spruce trees. The hives are facing the east, with sun exposure that lasts approximately 5 hours. There is a nearby field that is alternately planted with corn and soybeans. The hive is fully exposed to the elements with an evergreen screen at the back of the hives. Clover is a major forage source in the summer. Hive:
The hive consists of 3 medium 10 frame Langstroth boxes for a brood chamber and plastic foundation. The colony was headed by a one-year-old Italian queen at the beginning of 2011. Scale:
A Fairbanks platform scale with 0.5 lb divisions is leveled and exposed to weather. It was calibrated by comparison with an accurate bathroom scale.
|
|
|
|
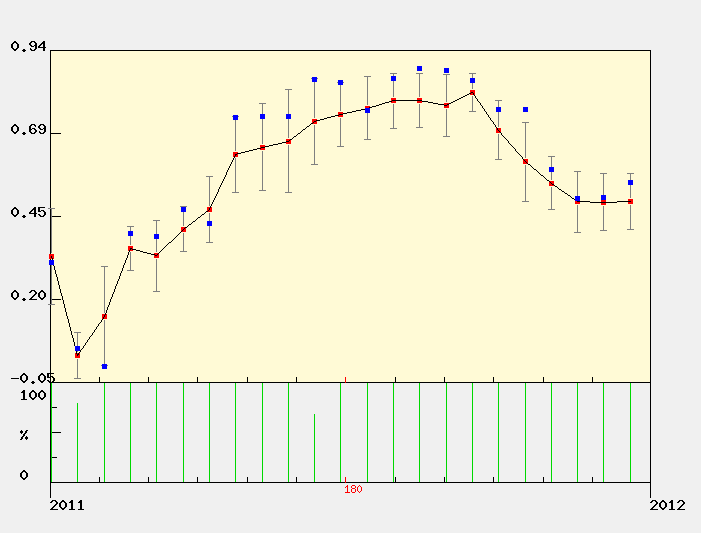
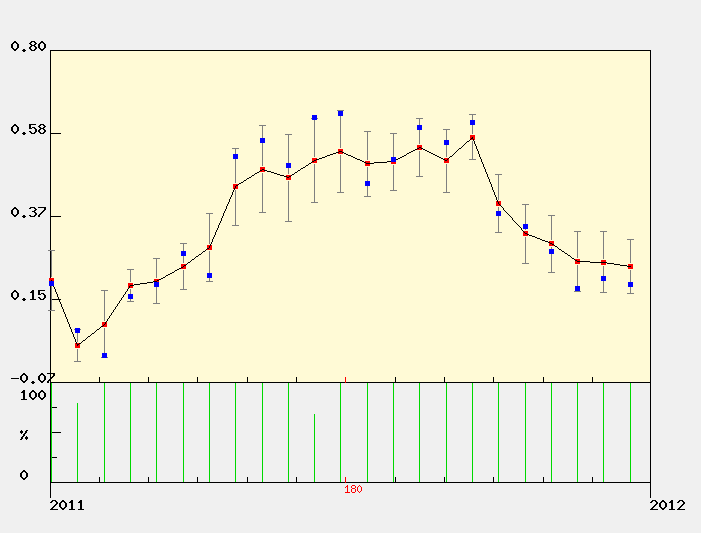
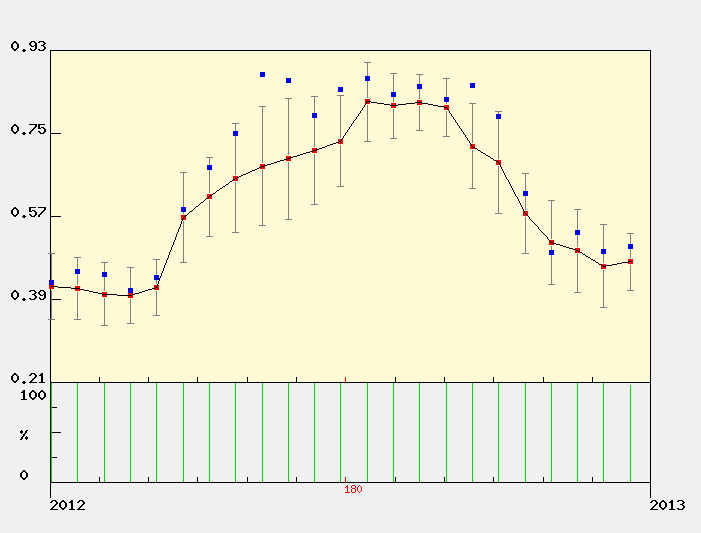
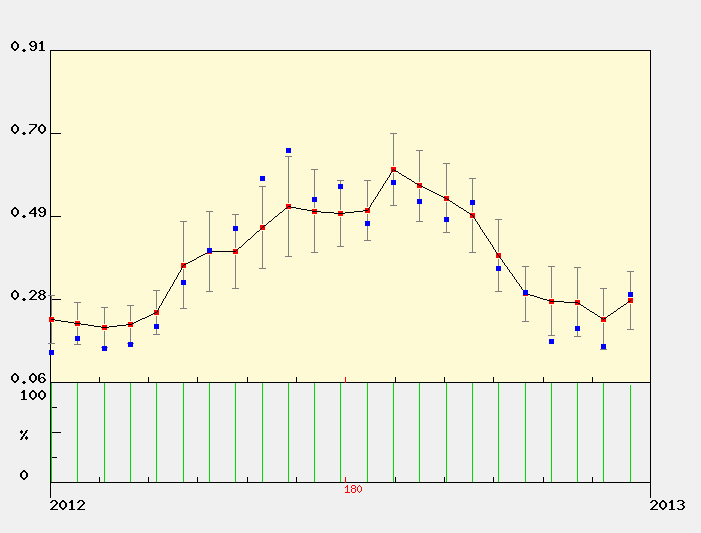
MODIS Subset Data (from the ORNL DAAC)
Red dots are the average of all pixels with acceptable quality (see landcover extract below for area covered).
Blue dots are the center pixel only (point is not plotted if the pixel is of unacceptable quality). |
| | | |
| NDVI The Normalized Difference Vegetation Index (NDVI) is the ratio of the difference between visible (red) and infra-red (IR) wavebands to the sum of these bands.
NDVI = nir - red / nir + red
NDVI provides an indication of the amount and vigor of vegetated surfaces.
NDVI has been widely used with multiple generations of satellite data.
|
 |
EVI
The Enhnaced Vegetation Index (EVI) is a more complicated combination of wavebands compared to the more widely used index, NDVI. The advantage of this newer index is improved sensitivity in high biomass regions and reduction in atmospheric influences.

where,
pNIR = NIR reflectance
pRed = red reflectance
pBlue = blue reflectance
C1 = atmosphere resistance red correction coefficient
C2 = atmosphere resistance blue correction coefficient
L = canopy background brightness
G = gain factor
|
|
The MODIS sensor on the Terra satellite platform provides us with 16-day composite measures of NDVI/EVI throughout the year. NASA distributes MODIS data from many of their distributed data centers.
|
|
|
|
MODIS Land Cover
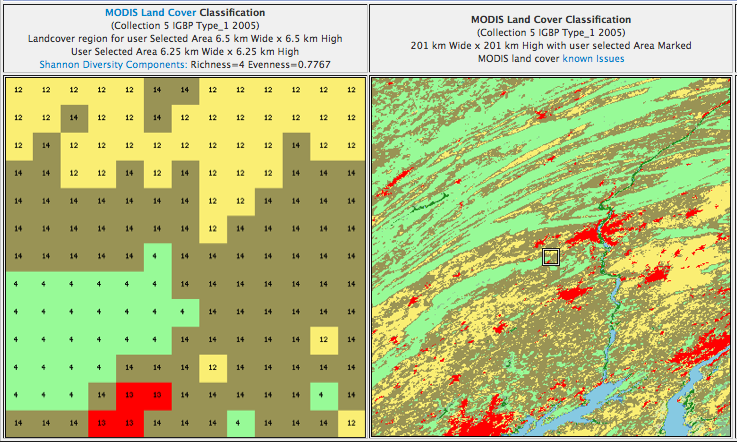

MODIS Data Subset Citation:
Oak Ridge National Laboratory Distributed Active Archive Center (ORNL DAAC). 2007. MODIS subsetted land products, Collection 4. Available on-line [http://www.daac.ornl.gov/MODIS/modis.html] from ORNL DAAC, Oak Ridge, Tennessee, U.S.A.. |
|
| |
| |