| Fort Collins, CO |
| Return to Regional/National map |
| County: Fort Collins |
State: CO |
|
| Active Since: 2010 |
Observer: Morisette |
| Lat/Long: 40.5, -105.1 |
Landsat WRS Path/Row: 34/32 |
| MODIS TIle V/H: 4/10 |
MODIS Line, Samp: 1132.17, 19.23 |
Site/Hive Description:
Hive located at the Gardens on Spring Creek. The site is on fairly flat terrain with a creek nearby. The Gardens are in a mostly residential area of Fort Collins, just south of the Colorado State University main campus.
The hive has two deep hive bodies each with ten frames with Duragilt foundations. There is one shallow super with a plastic top feeder, and an inner and outer cover. It was established in April 2009 at its current location using package bees and a queen from out of state. Measurements began in October of 2009. Scale:
Fairbanks, 1124 Series portable beam, 1000 lbs capacity, 0.5 lb increments, leveled on wooden base, exposed to weather. Forage:
Various plants associated with the community garden.
|
|
|
|
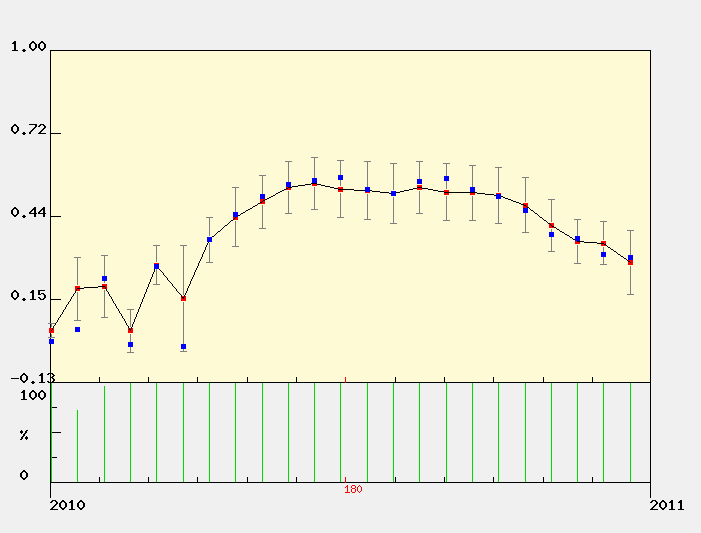
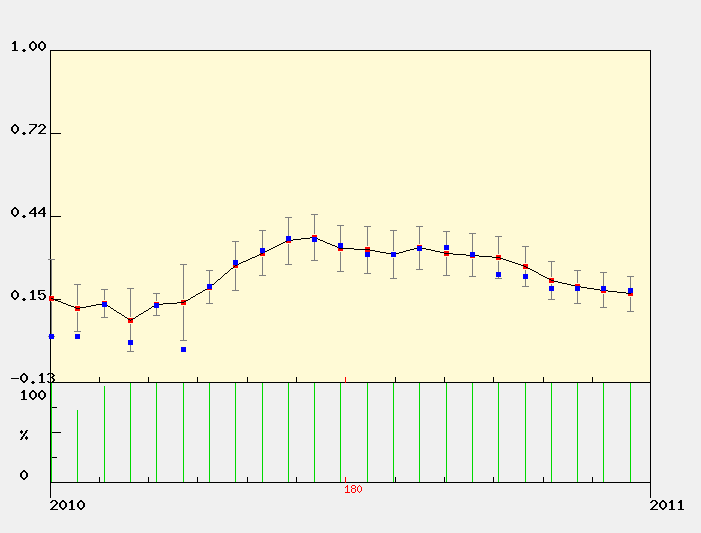
MODIS Subset Data (from the ORNL DAAC)
Red dots are the average of all pixels with acceptable quality (see landcover extract below for area covered).
Blue dots are the center pixel only (point is not plotted if the pixel is of unacceptable quality). |
| |
| NDVI The Normalized Difference Vegetation Index (NDVI) is the ratio of the difference between visible (red) and infra-red (IR) wavebands to the sum of these bands.
NDVI = nir - red / nir + red
NDVI provides an indication of the amount and vigor of vegetated surfaces.
NDVI has been widely used with multiple generations of satellite data.
|
 |
EVI
The Enhnaced Vegetation Index (EVI) is a more complicated combination of wavebands compared to the more widely used index, NDVI. The advantage of this newer index is improved sensitivity in high biomass regions and reduction in atmospheric influences.

where,
pNIR = NIR reflectance
pRed = red reflectance
pBlue = blue reflectance
C1 = atmosphere resistance red correction coefficient
C2 = atmosphere resistance blue correction coefficient
L = canopy background brightness
G = gain factor
|
|
The MODIS sensor on the Terra satellite platform provides us with 16-day composite measures of NDVI/EVI throughout the year. NASA distributes MODIS data from many of their distributed data centers.
|
|
|
|
MODIS Land Cover
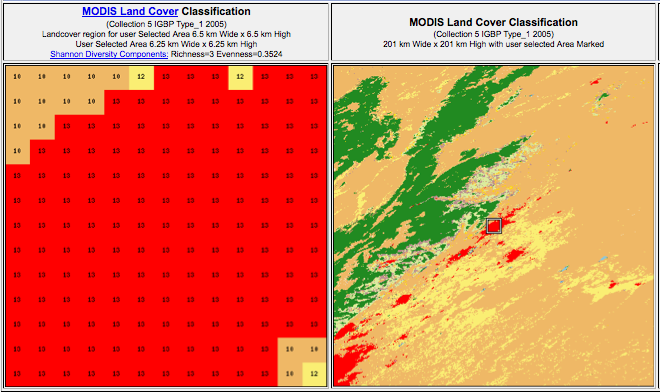

MODIS Data Subset Citation:
Oak Ridge National Laboratory Distributed Active Archive Center (ORNL DAAC). 2007. MODIS subsetted land products, Collection 4. Available on-line [http://www.daac.ornl.gov/MODIS/modis.html] from ORNL DAAC, Oak Ridge, Tennessee, U.S.A.. |
|
| |
| |
|