| Lansing, MI |
| Return to Regional/National map |
| County: Ingham |
State: MI |
|
| Active Since: 1954 |
Observer: Martin |
| Lat/Long: 42.7, -84.6 |
Landsat WRS Path/Row: 21/30 |
| MODIS TIle V/H: 4/11 |
MODIS Line, Samp: 867.10, 947.06 |
Site/Hive Description:
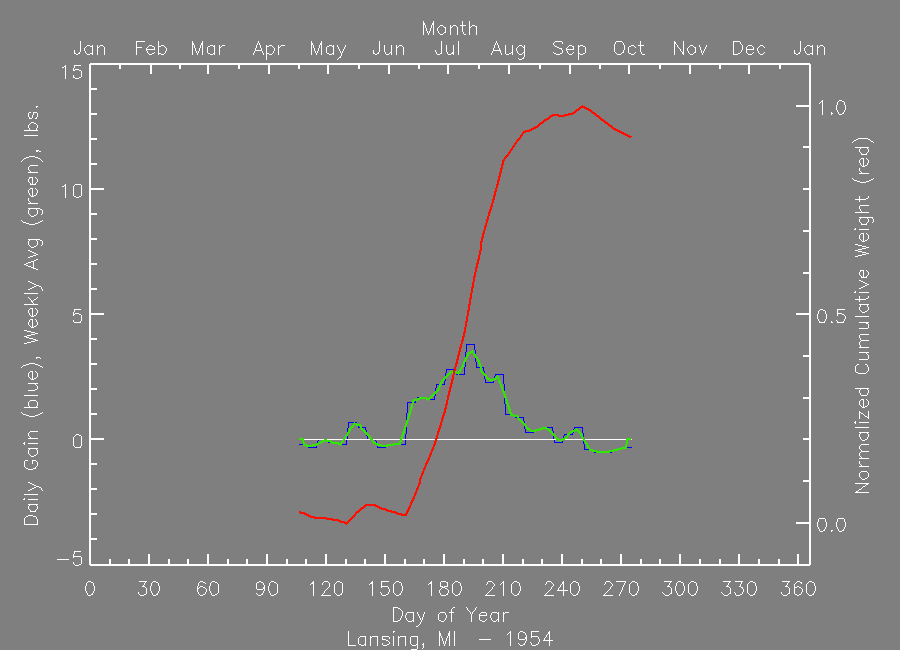
This historical record was provided by Dr. Roger Hoopingarner, retired MSU Apiarist in July 2010, his colleague, Dr. E. C. (Bert) Martin collected the data. Below is an account of the data record, edited for brevity from an email from Dr. Hoopingarner:
Bert died in January 2010 at the age of 99. I talked to him about the data in March of 2009, and although he had a very good memory, he could not remember the 12 cooperators that provided data. It is highly likely that the data were the lower half of Michigan. However, there were (and still are) many beekeepers along the west coast of Michigan up to Traverse City, thus it is possible that at least one of the records comes from that area. One of the data points was certainly MSU in East Lansing. Bert kept these scale colony records for the 25 years that he was at MSU, and I kept a record for 25 years that I was the apiculturist.
Unfortunately MSU discarded the actual records after Roger's retirement. We were left with only a plot of the data, from which the data here were derived. HoneyBeeNet is using Lansing to represent the central southern Michigan location of the data.
|
|
|
|
MODIS Subset Data (from the ORNL DAAC)
Red dots are the average of all pixels with acceptable quality (see landcover extract below for area covered).
Blue dots are the center pixel only (point is not plotted if the pixel is of unacceptable quality). |
| |
| NDVI The Normalized Difference Vegetation Index (NDVI) is the ratio of the difference between visible (red) and infra-red (IR) wavebands to the sum of these bands.
NDVI = nir - red / nir + red
NDVI provides an indication of the amount and vigor of vegetated surfaces.
NDVI has been widely used with multiple generations of satellite data.
|
 |
EVI
The Enhnaced Vegetation Index (EVI) is a more complicated combination of wavebands compared to the more widely used index, NDVI. The advantage of this newer index is improved sensitivity in high biomass regions and reduction in atmospheric influences.

where,
pNIR = NIR reflectance
pRed = red reflectance
pBlue = blue reflectance
C1 = atmosphere resistance red correction coefficient
C2 = atmosphere resistance blue correction coefficient
L = canopy background brightness
G = gain factor
|
|
The MODIS sensor on the Terra satellite platform provides us with 16-day composite measures of NDVI/EVI throughout the year. NASA distributes MODIS data from many of their distributed data centers.
|
|
|
|
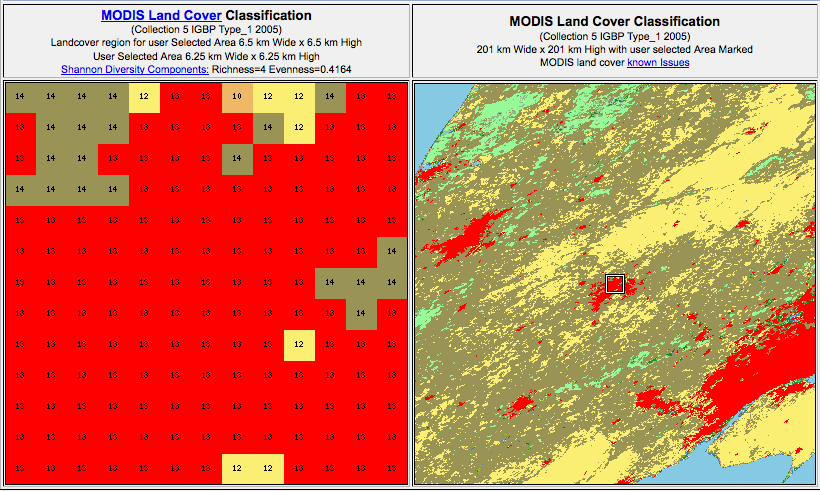
MODIS Land Cover

MODIS Data Subset Citation:
Oak Ridge National Laboratory Distributed Active Archive Center (ORNL DAAC). 2007. MODIS subsetted land products, Collection 4. Available on-line [http://www.daac.ornl.gov/MODIS/modis.html] from ORNL DAAC, Oak Ridge, Tennessee, U.S.A.. |
|
| |
| |
|