Skip all navigation and jump to content Jump to site navigation Jump to section navigation.
nasa meatball GSFC
NASA Logo - Goddard Space Flight Center + Visit NASA.gov
HoneyBeeNet banner image
ABOUT SCALE HIVES HONEYBEES SITE DATA NEWS LINKS
Stillwater, OK
Return to Regional/National map
County:  Payne State: OK
Active Since: 1938 Observer: Bieberdorf
Lat/Long: 36.1, -97.1 Landsat WRS Path/Row: 27/35
MODIS TIle V/H: 5/10 MODIS Line, Samp: 463.90, 189.66

Site/Hive Description:

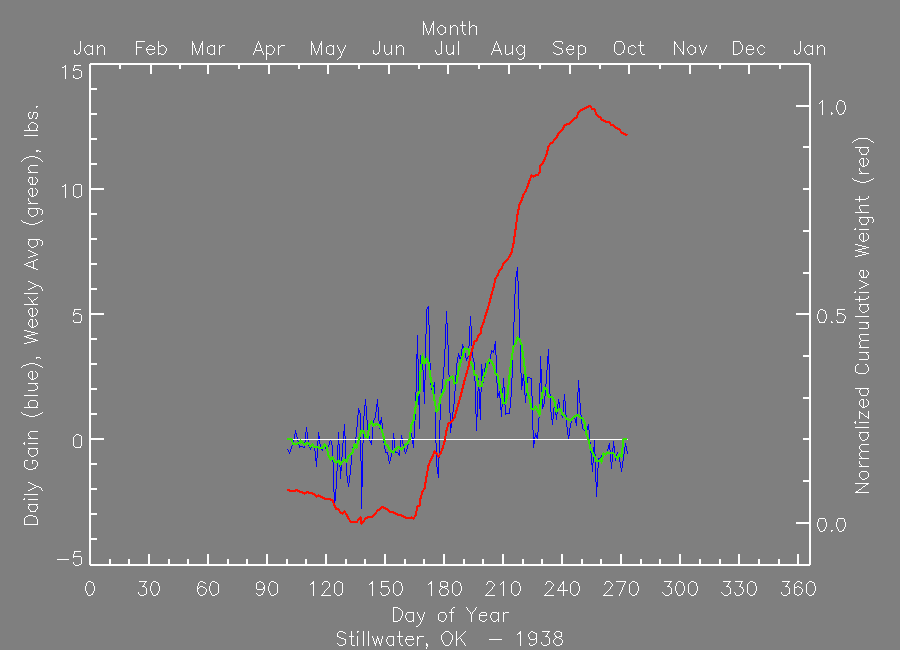
These data were read from a figure in Bieberdorf, G.A. & E. Hale. The nectar flow at Stillwater during 1938 as indicated by a scale colony of bees. Proceedings of the Oklahoma Academy of Sciences for 1938. pp 78-80.
Note: The figure is on p 78, whereas the article begins on p 79.

The paper describes the nectar flow in 1938 as beginning later than usual, with higher gains in Jun/Jul than previous years.
The nectar sources are listed in order of appearance - locust in the spring, followed by false indigo, hoar-hound, yellow sweet clover, vetch, alfalfa, white sweet clover, horsemint, chinaberry and cotton on Jul 25.
In 1938 most nectar in Jun and the first 2 wks in Jul was from sweet clover and alfalfa, while alfalfa and cotton dominated in the last 2 wks of Jul thru Aug. Typically there is a dearth from mid Jul to Aug, with a fall flow (the second of the year) beginning in mid-Sep.

If anyone knows where the OSU apiary was located in 1938, please let us know.


Nectar Flow Data 1938

Download Data File (comma delimited), download QA flag key


MODIS Subset Data (from the ORNL DAAC)
Red dots are the average of all pixels with acceptable quality (see landcover extract below for area covered).
Blue dots are the center pixel only (point is not plotted if the pixel is of unacceptable quality).


NDVI

The Normalized Difference Vegetation Index (NDVI) is the ratio of the  difference between visible (red) and infra-red (IR) wavebands to the sum of these bands. 

NDVI = nir - red / nir + red


 NDVI provides an indication of the amount and vigor of vegetated  surfaces. 

 NDVI has been widely used with multiple generations of satellite data.

EVI

 The Enhnaced Vegetation Index (EVI) is a more complicated combination of wavebands compared to the more widely used index, NDVI.  The advantage of this newer index is improved sensitivity in high biomass regions and reduction in atmospheric influences.
where,
pNIR = NIR reflectance
pRed = red reflectance
pBlue = blue reflectance
C1 = atmosphere resistance red correction coefficient
C2 = atmosphere resistance blue correction coefficient
L = canopy background brightness
G = gain factor


The MODIS sensor on the Terra satellite platform provides us with 16-day composite measures of NDVI/EVI throughout the year.  NASA distributes MODIS data from many of their distributed data centers.

MODIS Land Cover

MODIS Data Subset Citation:
Oak Ridge National Laboratory Distributed Active Archive Center (ORNL DAAC). 2007. MODIS subsetted land products, Collection 4. Available on-line [http://www.daac.ornl.gov/MODIS/modis.html] from ORNL DAAC, Oak Ridge, Tennessee, U.S.A..


FirstGov logo + Privacy Policy and Important Notices NASA Curator: Jaime Nickeson
NASA Official: Sadashiva Devadiga
Last Updated: February 1, 2024