| Hope, AR |
| Return to Regional/National map |
| County: Hope-Hempstead |
State: AR |
|
| Active Since: 1939 |
Observer: Thompson |
| Lat/Long: 33.7, -93.6 |
Landsat WRS Path/Row: 25/37 |
| MODIS TIle V/H: 5/10 |
MODIS Line, Samp: 750.85, 260.07 |
Site/Hive Description:
These data represent a summary of all data from 1938 through 1951, based on weekly gains. Each weekly average includes data from up to 147 colonies (equally weighted). The period from 1938 to 1943 is represented by only one colony.
The data were obtained from 5 apiaries north and east of Hope, identified in the literature only by an 8 pt azimuth and distance in tenths of miles from nearest towns. We estimated the location of each apiary using this information then took the mean of the 5 locations to provide the single location given here.
There is variability among the 5 apiaries, but all are dominated by strong spring and fall nectar flows. Thompson, V.C. Nectar flows and Pollen Yield in Southwestern Arkansas, 1945-1951. 1960. Arkansas Agri. Expt. Station Report Series 94. Ark. Div. Agriculture, 38 pp.
|
|
|
|
MODIS Subset Data (from the ORNL DAAC)
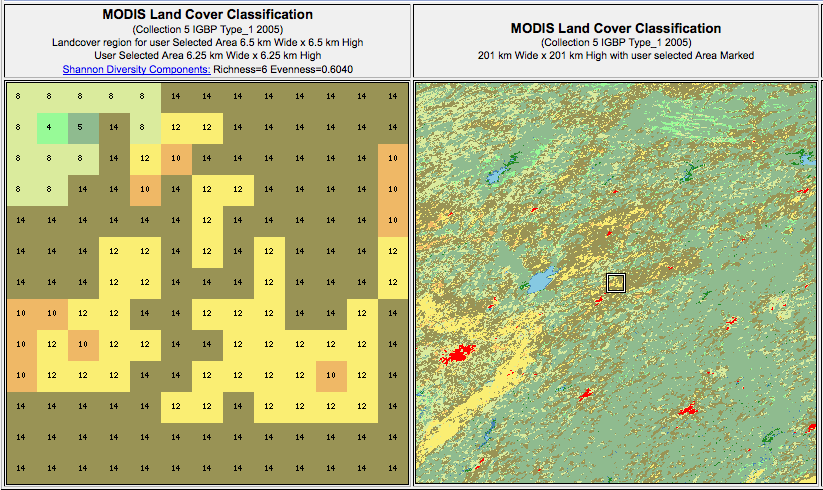
Red dots are the average of all pixels with acceptable quality (see landcover extract below for area covered).
Blue dots are the center pixel only (point is not plotted if the pixel is of unacceptable quality). |
| |
| NDVI The Normalized Difference Vegetation Index (NDVI) is the ratio of the difference between visible (red) and infra-red (IR) wavebands to the sum of these bands.
NDVI = nir - red / nir + red
NDVI provides an indication of the amount and vigor of vegetated surfaces.
NDVI has been widely used with multiple generations of satellite data.
|
 |
EVI
The Enhnaced Vegetation Index (EVI) is a more complicated combination of wavebands compared to the more widely used index, NDVI. The advantage of this newer index is improved sensitivity in high biomass regions and reduction in atmospheric influences.

where,
pNIR = NIR reflectance
pRed = red reflectance
pBlue = blue reflectance
C1 = atmosphere resistance red correction coefficient
C2 = atmosphere resistance blue correction coefficient
L = canopy background brightness
G = gain factor
|
|
The MODIS sensor on the Terra satellite platform provides us with 16-day composite measures of NDVI/EVI throughout the year. NASA distributes MODIS data from many of their distributed data centers.
|
|
|
|
MODIS Land Cover

MODIS Data Subset Citation:
Oak Ridge National Laboratory Distributed Active Archive Center (ORNL DAAC). 2007. MODIS subsetted land products, Collection 4. Available on-line [http://www.daac.ornl.gov/MODIS/modis.html] from ORNL DAAC, Oak Ridge, Tennessee, U.S.A.. |
|
| |
| |
|


_plot.png)
