| Frederick, MD |
| Return to Regional/National map |
| County: Frederick |
State: MD |
|
| Active Since: 2008 |
Observer: |
| Lat/Long: 39.3, -77.4 |
Landsat WRS Path/Row: 15/33 |
| MODIS TIle V/H: 5/12 |
MODIS Line, Samp: 80.09, 16.98 |
Site/Hive Description:
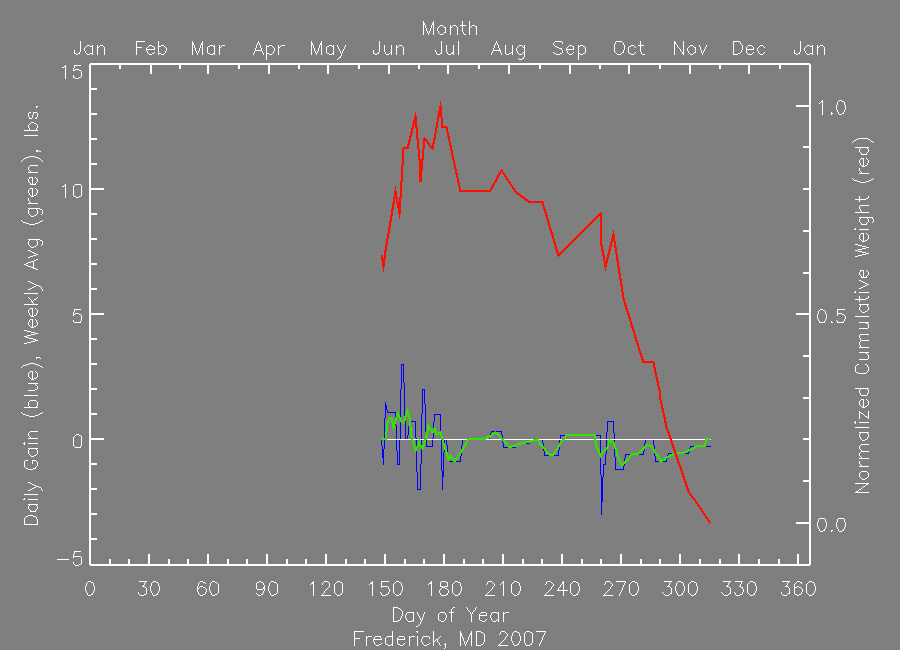
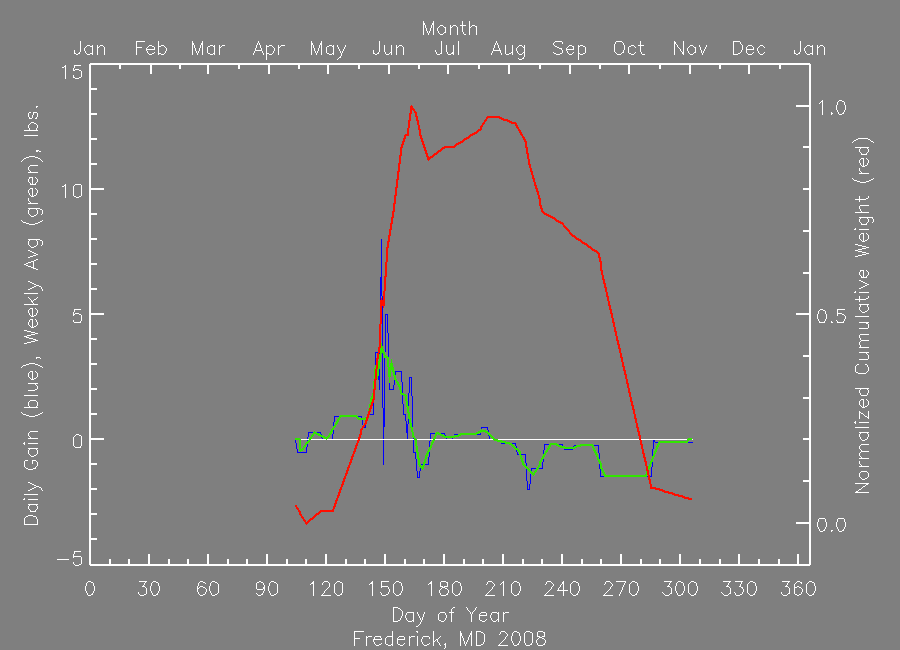
Black locust, tulip poplar, and sumac trees are common in this area of rolling farmland and overgrown pastures; there are mature woodlands interspersed throughout. The small farms are usually planted in soybean, corn, or wheat. Most housing parcels are lots of size 1 acre or larger.
In the spring, there are various wild small plants and shrubs—yellow mustard, honeysuckle bush, etc…In the fall there is a lot of goldenrod and aster around. Scale: Old Fairbanks platform scale, at least 500 lb capacity, 0.5 lb increments, leveled on wooden base, exposed to weather. Hive: Standard Langstroth in 2 unpainted cypress deeps with medium supers added during honey flow.
|
|
|
|
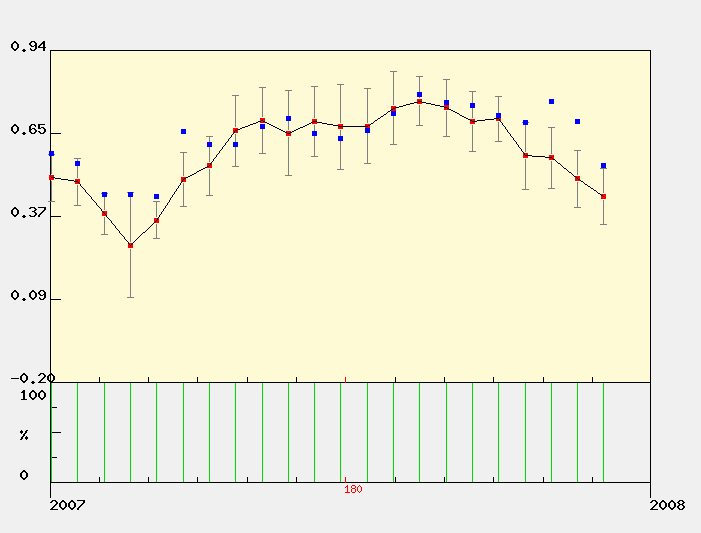
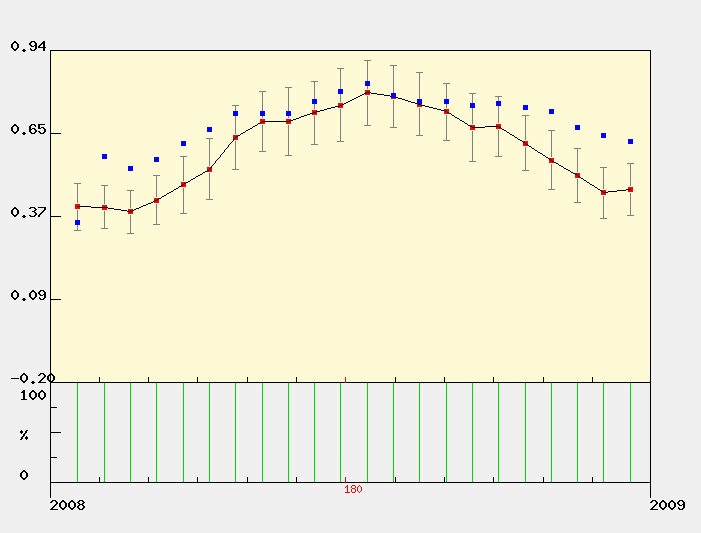
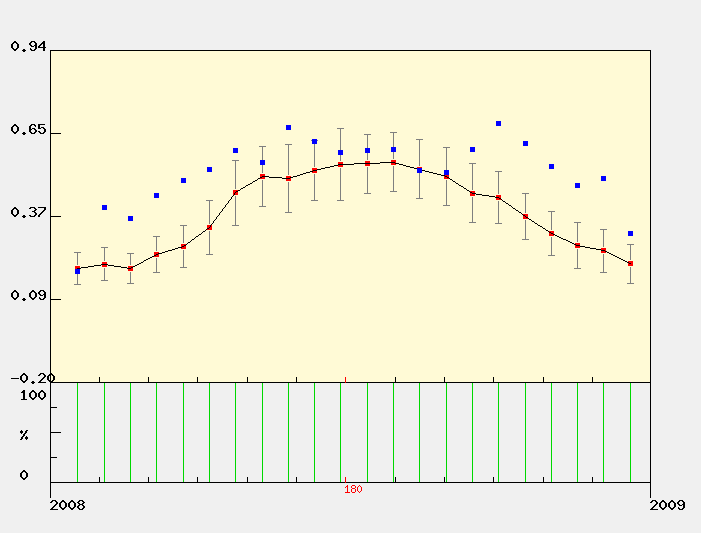
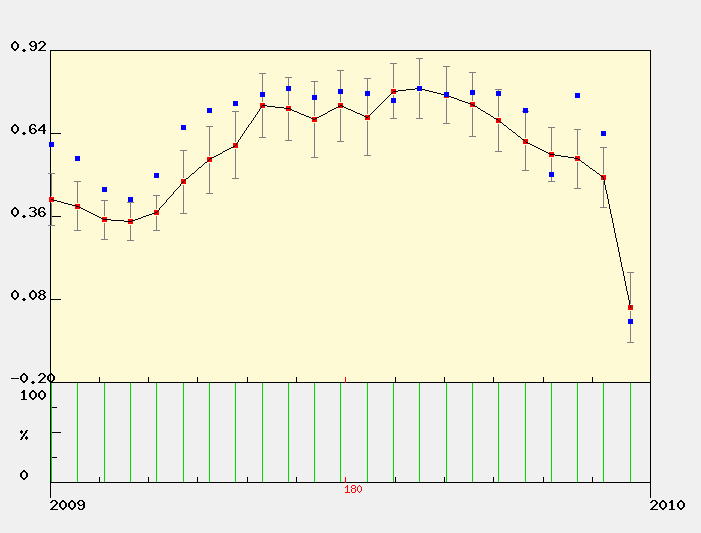
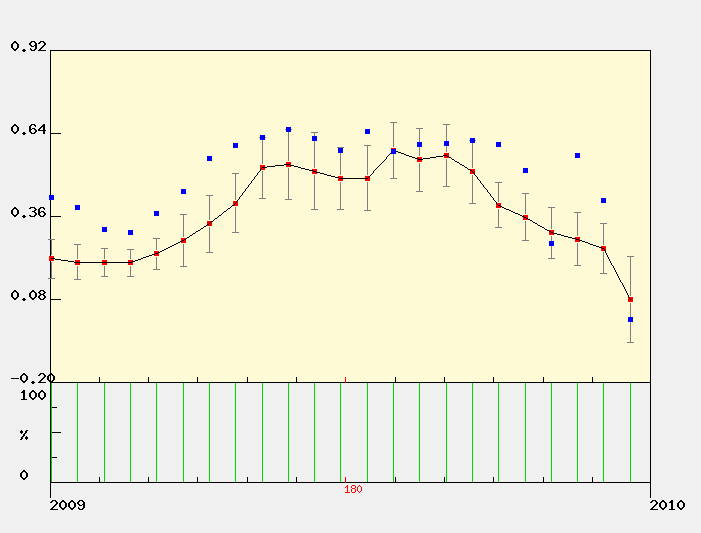
MODIS Subset Data (from the ORNL DAAC)
Red dots are the average of all pixels with acceptable quality (see landcover extract below for area covered).
Blue dots are the center pixel only (point is not plotted if the pixel is of unacceptable quality). |
| | | | | |
| NDVI The Normalized Difference Vegetation Index (NDVI) is the ratio of the difference between visible (red) and infra-red (IR) wavebands to the sum of these bands.
NDVI = nir - red / nir + red
NDVI provides an indication of the amount and vigor of vegetated surfaces.
NDVI has been widely used with multiple generations of satellite data.
|
 |
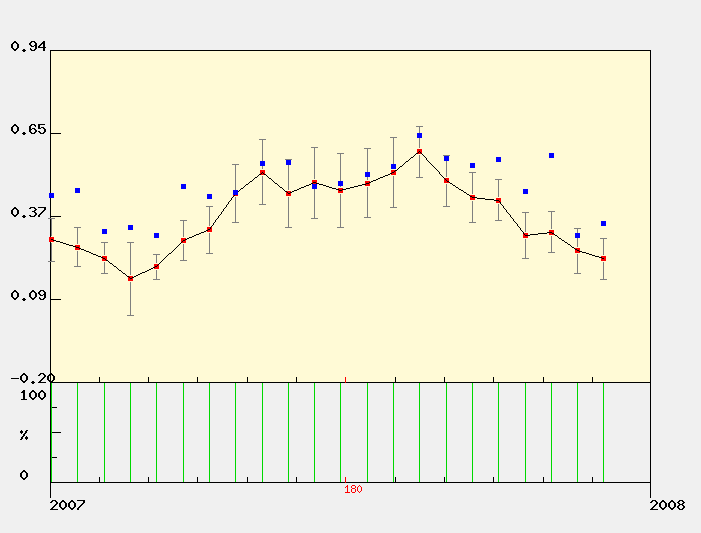
EVI
The Enhnaced Vegetation Index (EVI) is a more complicated combination of wavebands compared to the more widely used index, NDVI. The advantage of this newer index is improved sensitivity in high biomass regions and reduction in atmospheric influences.

where,
pNIR = NIR reflectance
pRed = red reflectance
pBlue = blue reflectance
C1 = atmosphere resistance red correction coefficient
C2 = atmosphere resistance blue correction coefficient
L = canopy background brightness
G = gain factor
|
|
The MODIS sensor on the Terra satellite platform provides us with 16-day composite measures of NDVI/EVI throughout the year. NASA distributes MODIS data from many of their distributed data centers.
|
|
|
|
MODIS Land Cover
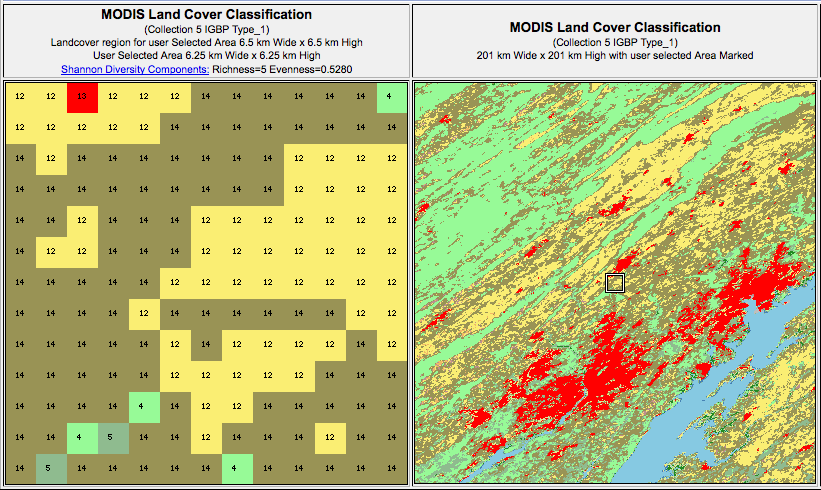

MODIS Data Subset Citation:
Oak Ridge National Laboratory Distributed Active Archive Center (ORNL DAAC). 2007. MODIS subsetted land products, Collection 4. Available on-line [http://www.daac.ornl.gov/MODIS/modis.html] from ORNL DAAC, Oak Ridge, Tennessee, U.S.A.. |
|
| |
| |
|