| Church Hill, MD |
| Return to Regional/National map |
| County: Queen Anne's |
State: MD |
|
| Active Since: 2007 |
Observer: Smith |
| Lat/Long: 39.1,-76.0 |
Landsat WRS Path/Row: 15/33 |
| MODIS TIle V/H: 5/12 |
MODIS Line, Samp: 101.68, 122.84 |
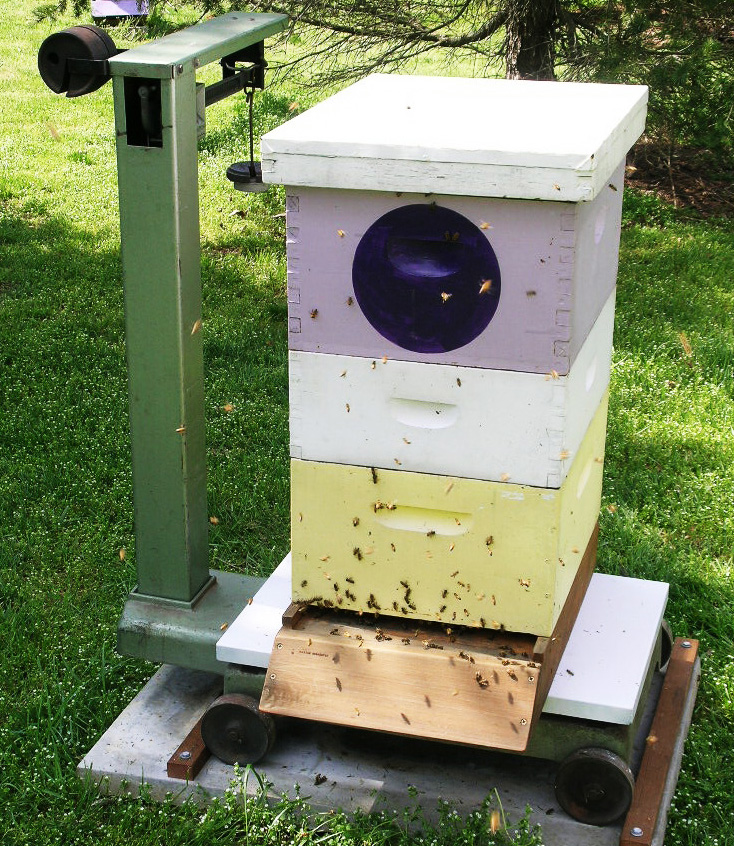
Site/Hive Description:
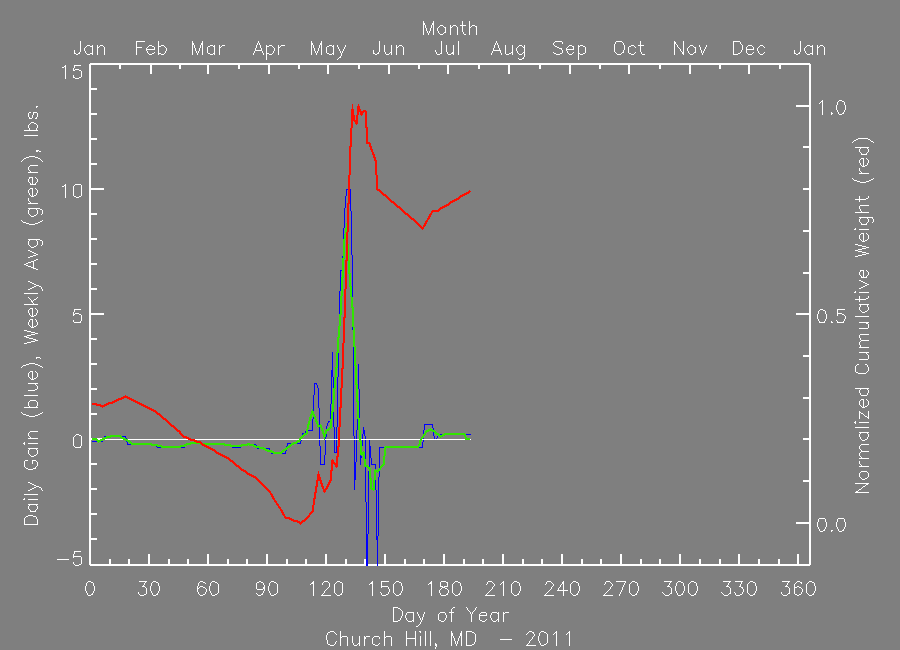
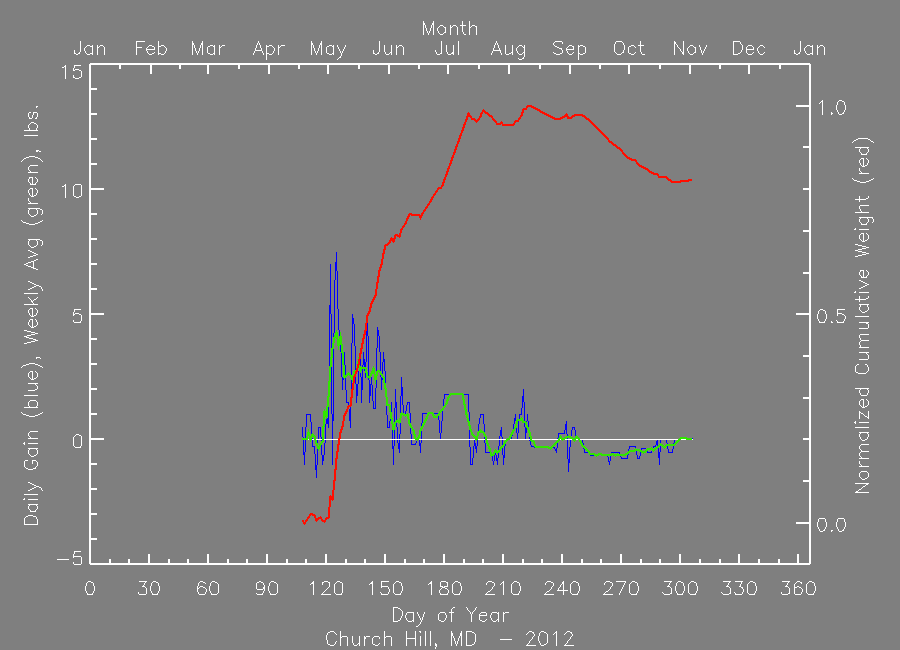
The scale hive is located on the eastern shore of Maryland, which consists of mostly farmland – primarily corn, soybeans, and wheat. The site is very near the Chester River, with roughly 50% of the land nearby devoted to agriculture. The apiary has a broad southern exposure and receives full sun from early morning until mid-afternoon. Several of the colonies have solar-powered fan ventilation throughout the summer. All colonies are on screened bottom boards. Scale is vintage Detecto shipping scale with a 18 x 28 inch platform and 500lb capacity. Hive and scale exposed to weather, leveled on a wooden base. Although the wooded areas contain some tulip poplar trees, the majority of floral sources consist of white clover, home landscape plants and roadside wild flowers.
|
|
|
|
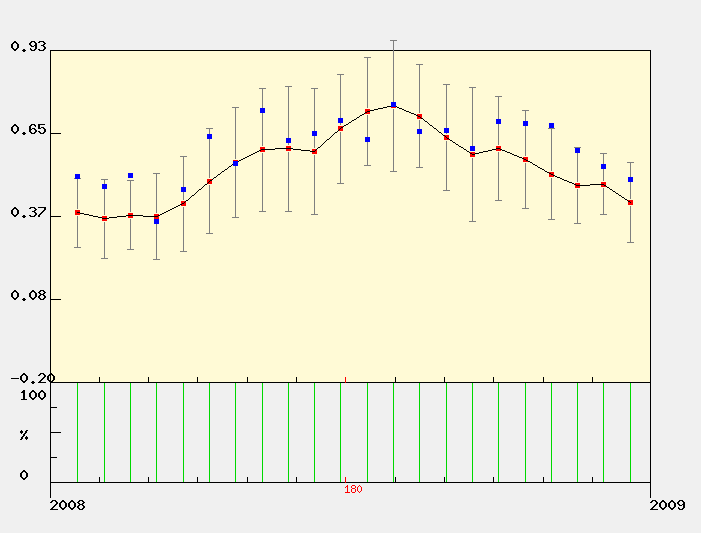
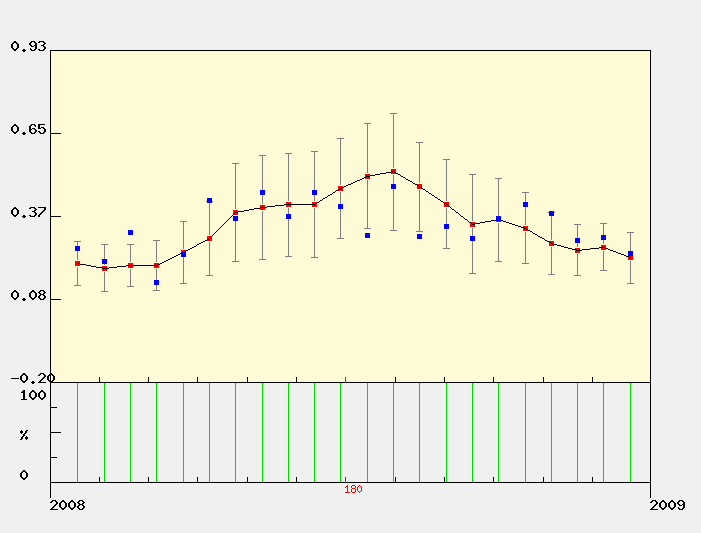
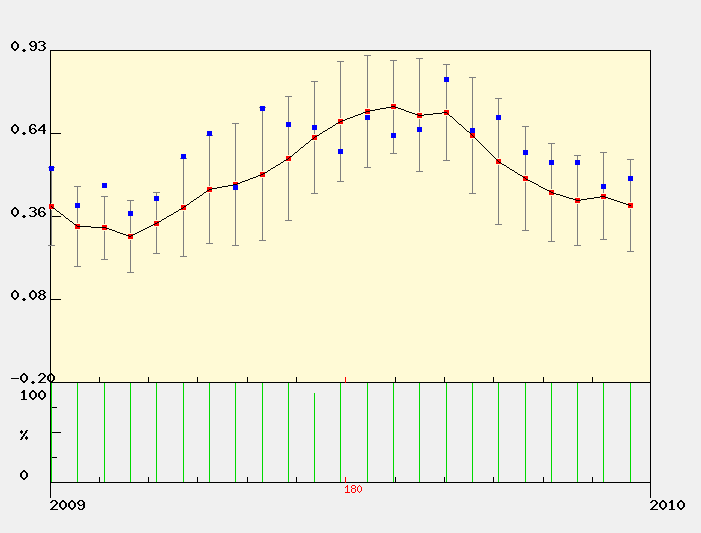
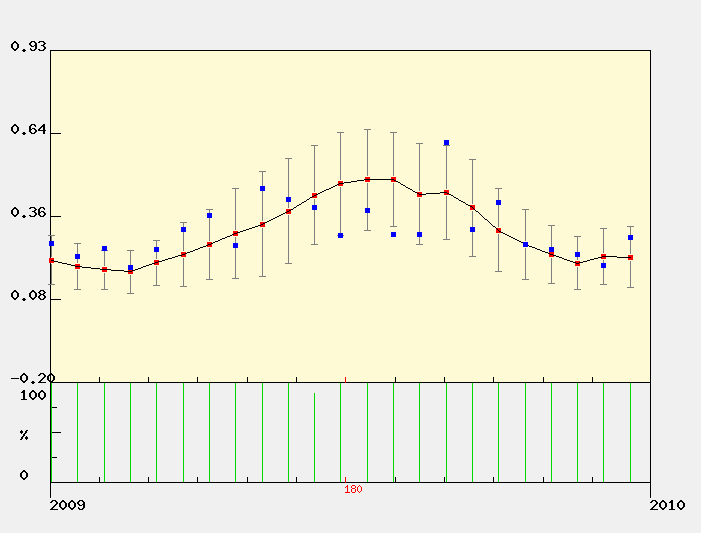
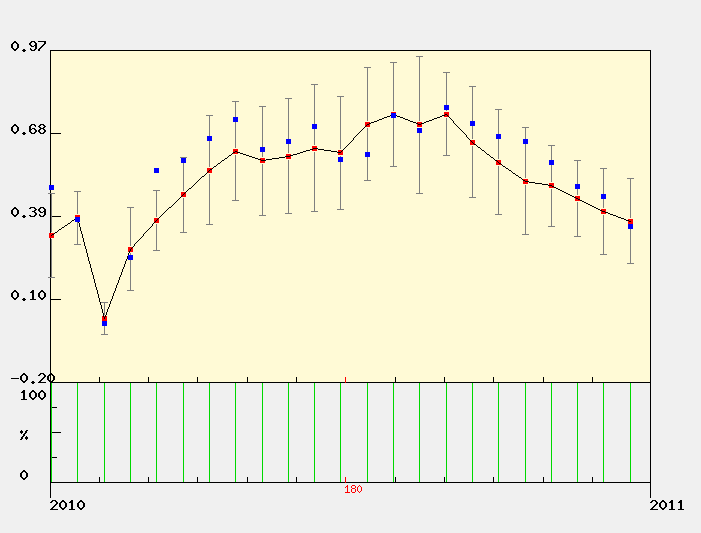
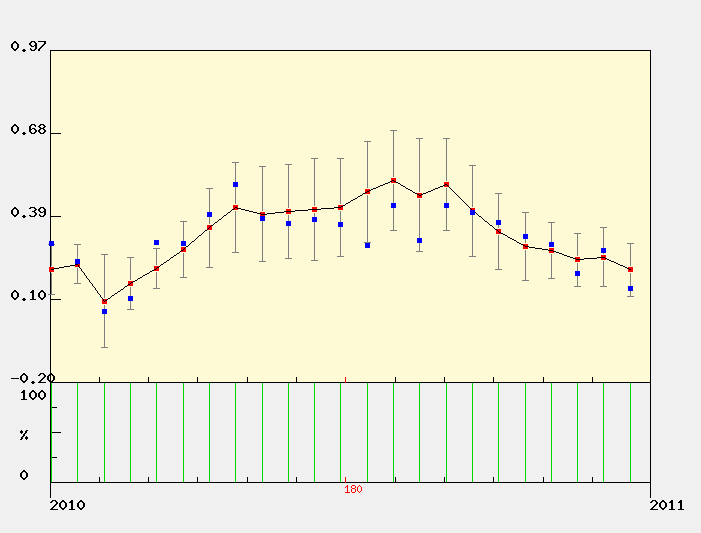
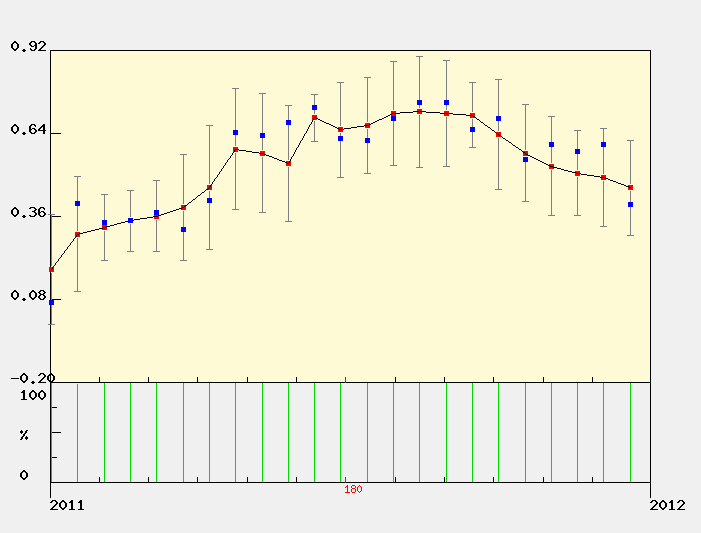
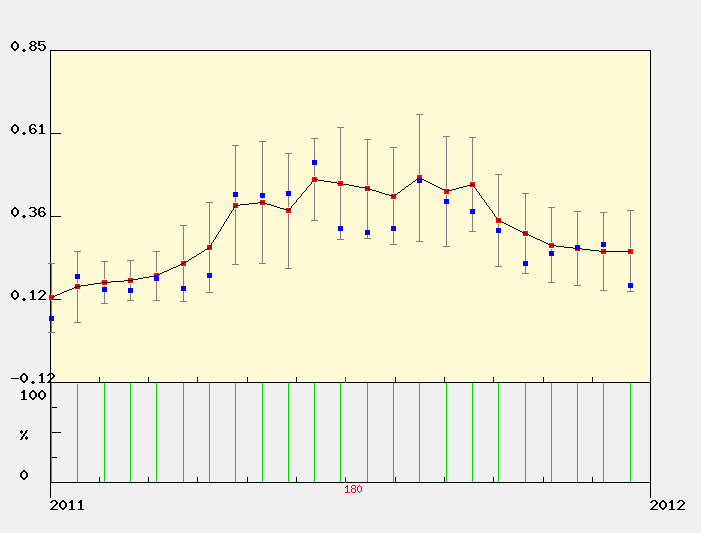
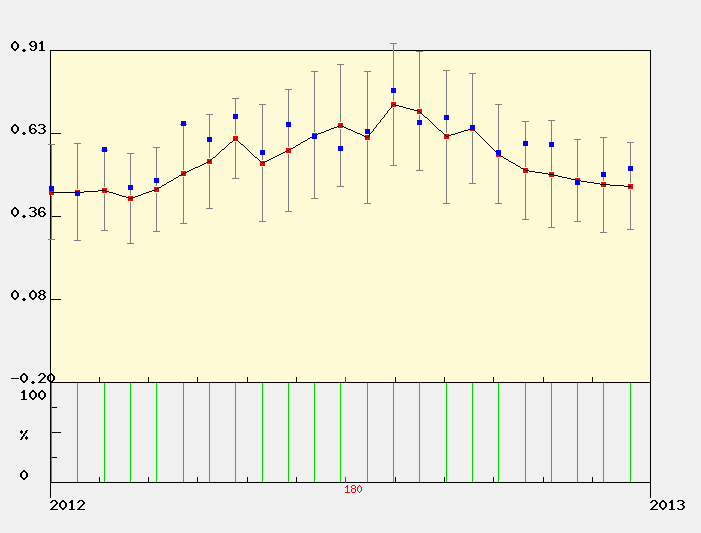
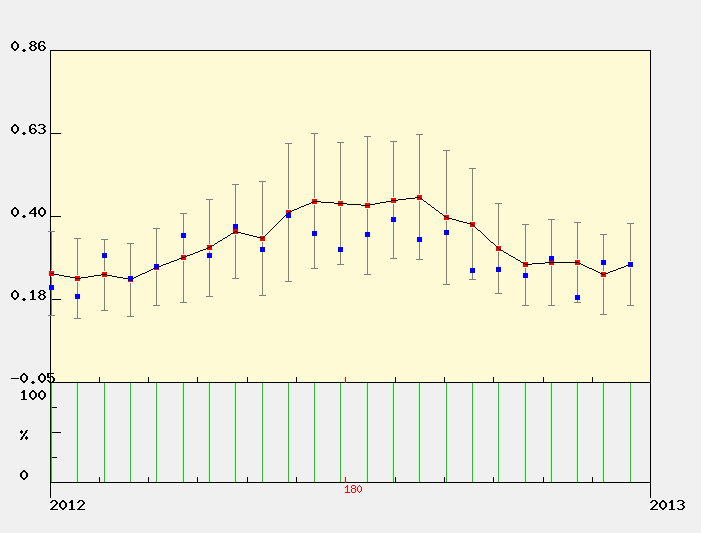
MODIS Subset Data (from the ORNL DAAC)
Red dots are the average of all pixels with acceptable quality (see landcover extract below for area covered).
Blue dots are the center pixel only (point is not plotted if the pixel is of unacceptable quality). |
| | | | | | | | | |
| NDVI The Normalized Difference Vegetation Index (NDVI) is the ratio of the difference between visible (red) and infra-red (IR) wavebands to the sum of these bands.
NDVI = nir - red / nir + red
NDVI provides an indication of the amount and vigor of vegetated surfaces.
NDVI has been widely used with multiple generations of satellite data.
|
 |
EVI
The Enhnaced Vegetation Index (EVI) is a more complicated combination of wavebands compared to the more widely used index, NDVI. The advantage of this newer index is improved sensitivity in high biomass regions and reduction in atmospheric influences.

where,
pNIR = NIR reflectance
pRed = red reflectance
pBlue = blue reflectance
C1 = atmosphere resistance red correction coefficient
C2 = atmosphere resistance blue correction coefficient
L = canopy background brightness
G = gain factor
|
|
The MODIS sensor on the Terra satellite platform provides us with 16-day composite measures of NDVI/EVI throughout the year. NASA distributes MODIS data from many of their distributed data centers.
|
|
|
|
MODIS Land Cover
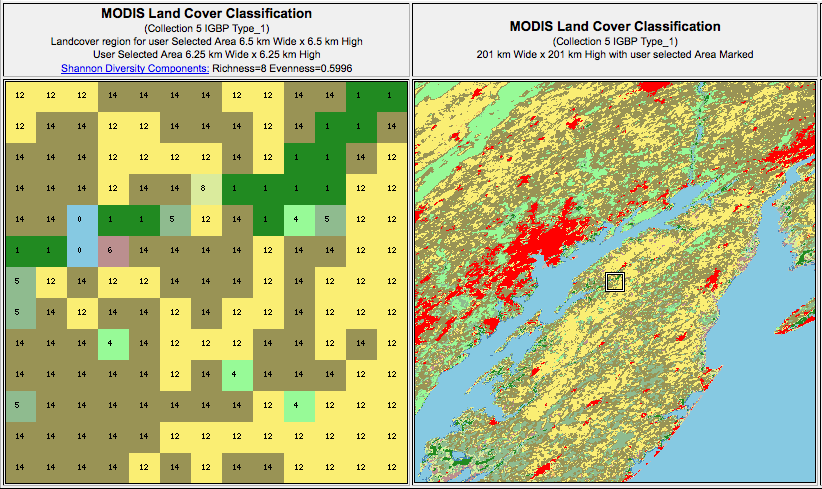

MODIS Data Subset Citation:
Oak Ridge National Laboratory Distributed Active Archive Center (ORNL DAAC). 2007. MODIS subsetted land products, Collection 4. Available on-line [http://www.daac.ornl.gov/MODIS/modis.html] from ORNL DAAC, Oak Ridge, Tennessee, U.S.A.. |
|
| |
| |
|