| Rockford, WV |
| Return to Regional/National map |
| County: Harrison |
State: WV |
|
| Active Since: 1989 |
Observer: Cox |
| Lat/Long: 39.1, -80.3 |
Landsat WRS Path/Row: 17/33 |
| MODIS TIle V/H: 5/11 |
MODIS Line, Samp: 103.06, 922.70 |
Site/Hive Description:
Hive is located on property 125 ft from back door of house at the edge of a meadow. Hive is made up of 4 ten-frame medium supers with Buckfast bees. Forage consists of Autumn Olive, Tartarian Honeysuckle, and Black Locust in April and May, as well as Tulip poplar into Jne. In the fall there is Wing Stem, Goldenrod, and Aster.
|
|
|
| Nectar Flow Data 1989 | Download Data File (comma delimited), download QA flag key 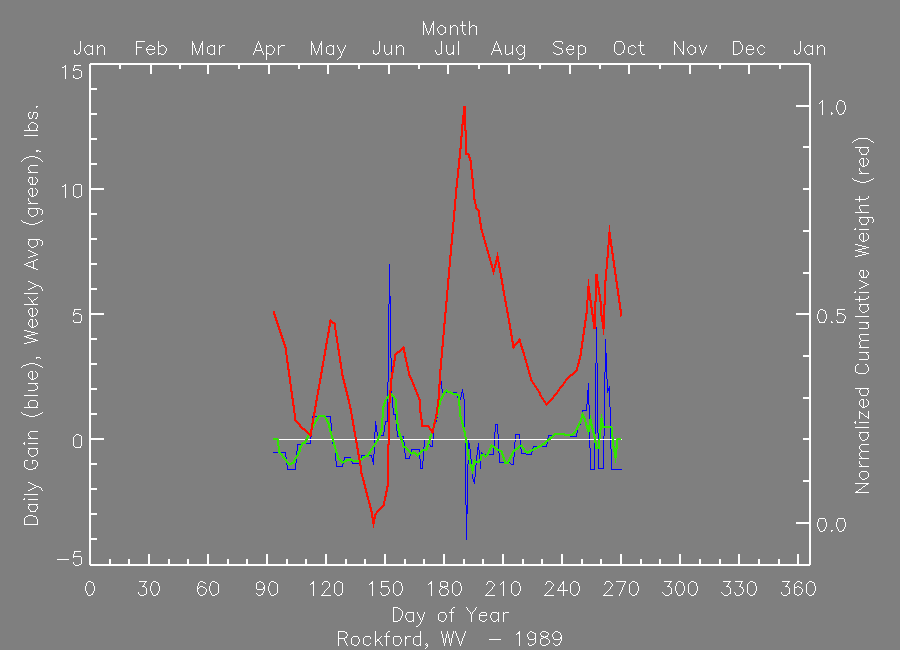
| | | Nectar Flow Data 1990 | Download Data File (comma delimited), download QA flag key 
| | | Nectar Flow Data 1991 | Download Data File (comma delimited), download QA flag key 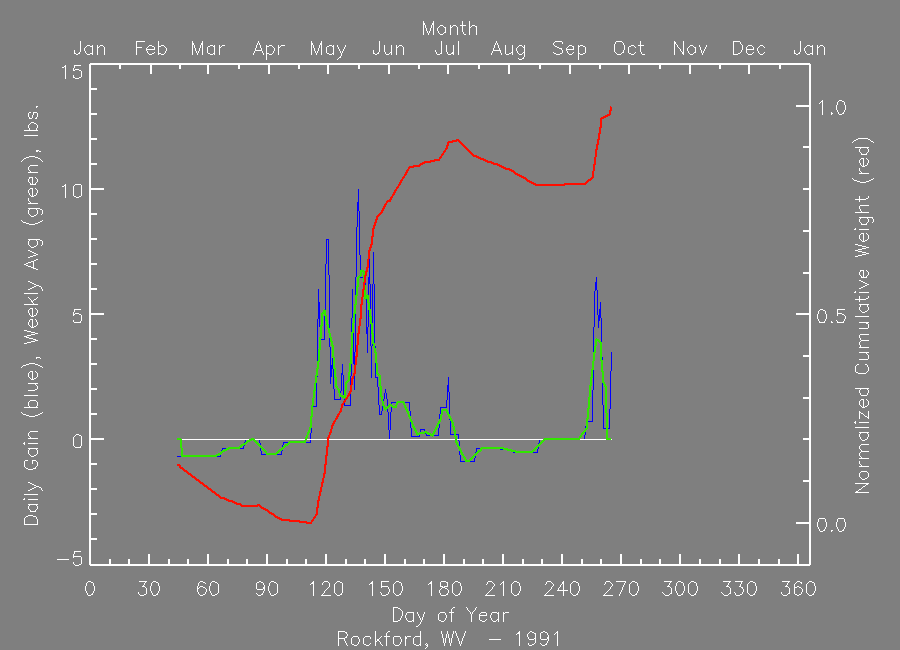
| | | Nectar Flow Data 1992 | Download Data File (comma delimited), download QA flag key 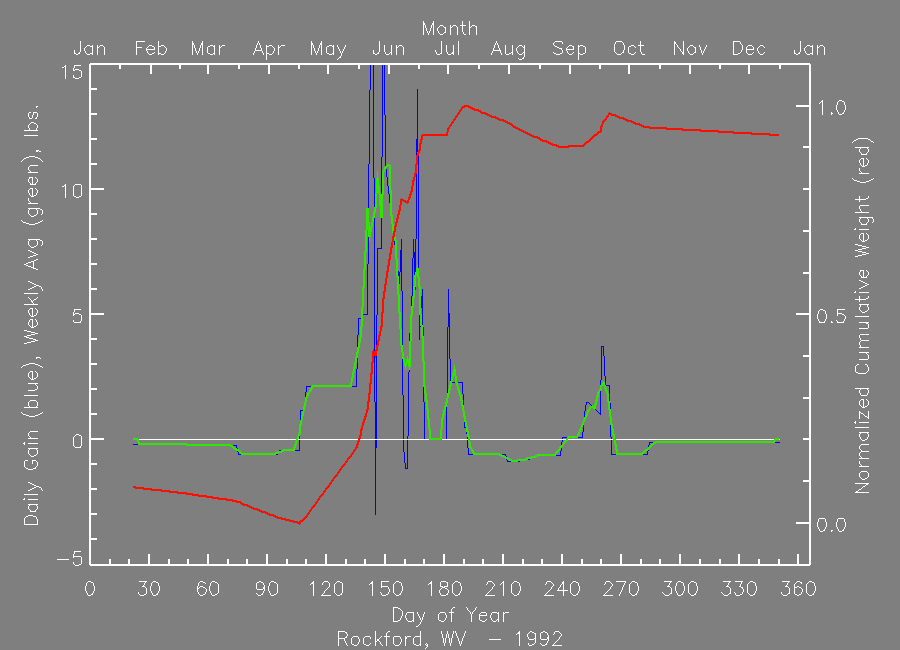
| | | Nectar Flow Data 1995 | Download Data File (comma delimited), download QA flag key 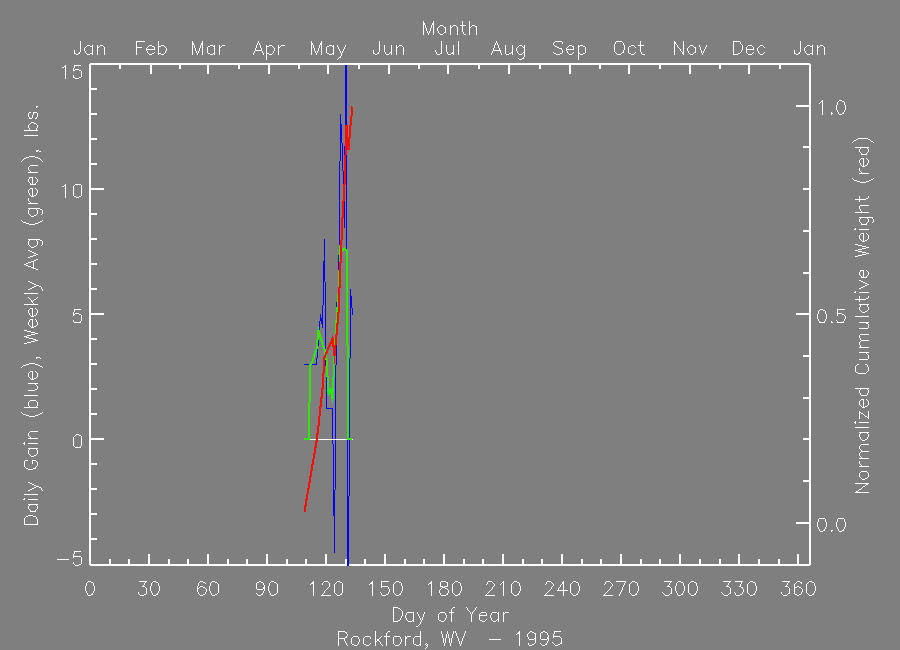
| | | Nectar Flow Data 1998 | Download Data File (comma delimited), download QA flag key 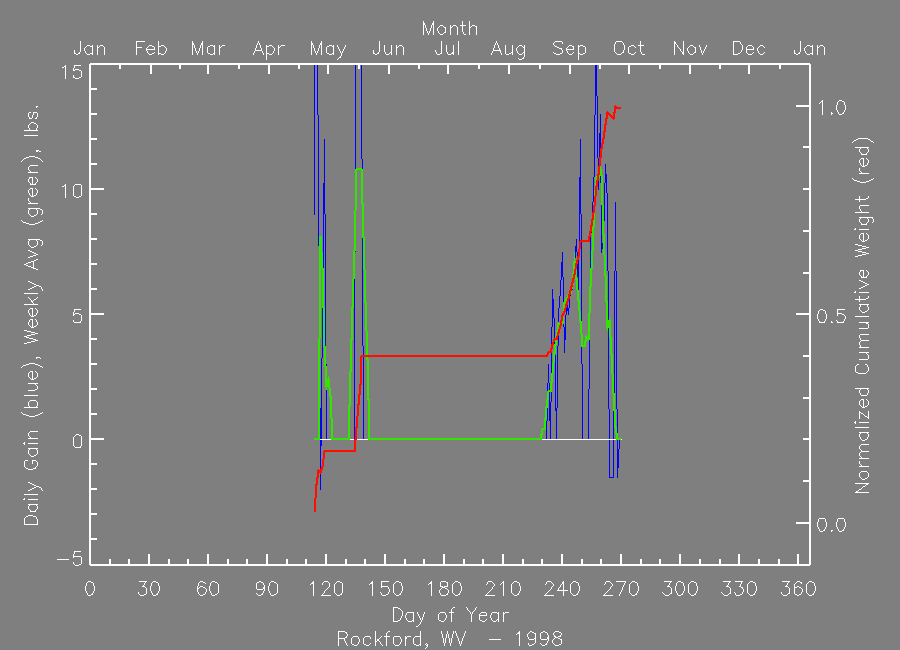
| | | Nectar Flow Data 1999 | Download Data File (comma delimited), download QA flag key 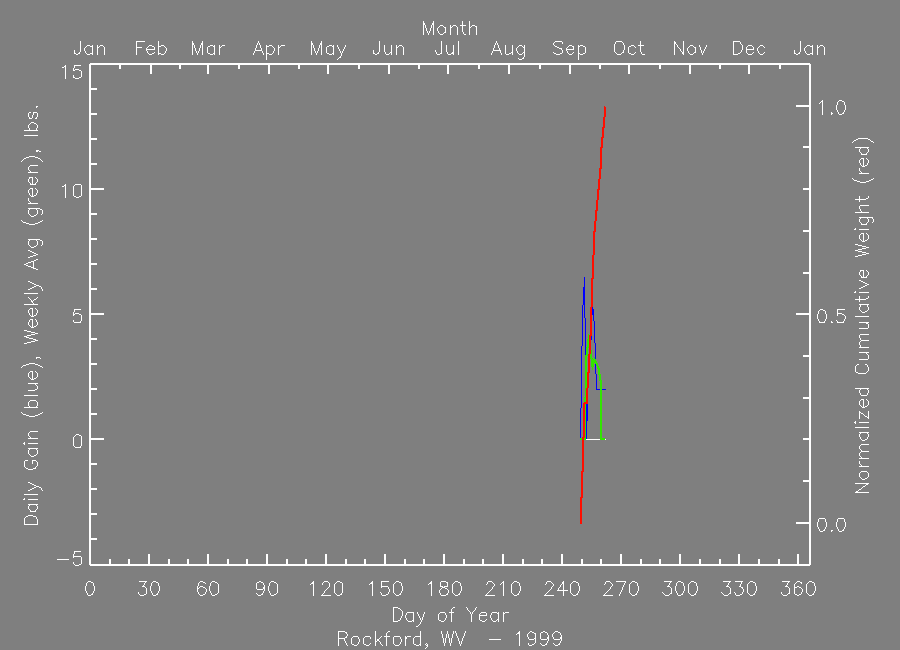
| | | Nectar Flow Data 2000 | Download Data File (comma delimited), download QA flag key 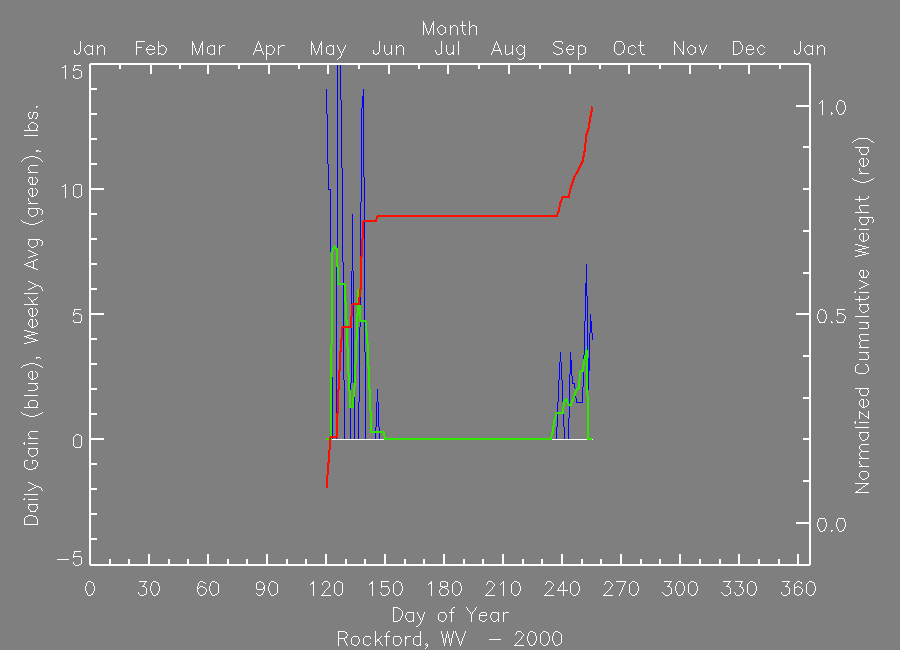
| | | Nectar Flow Data 2001 | Download Data File (comma delimited), download QA flag key 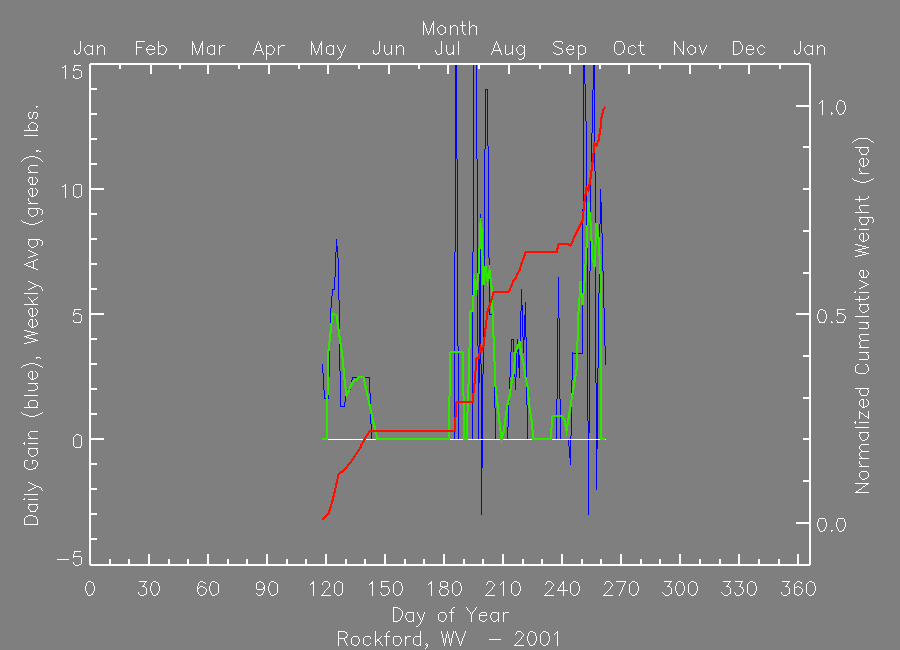
| | | Nectar Flow Data 2002 | Download Data File (comma delimited), download QA flag key 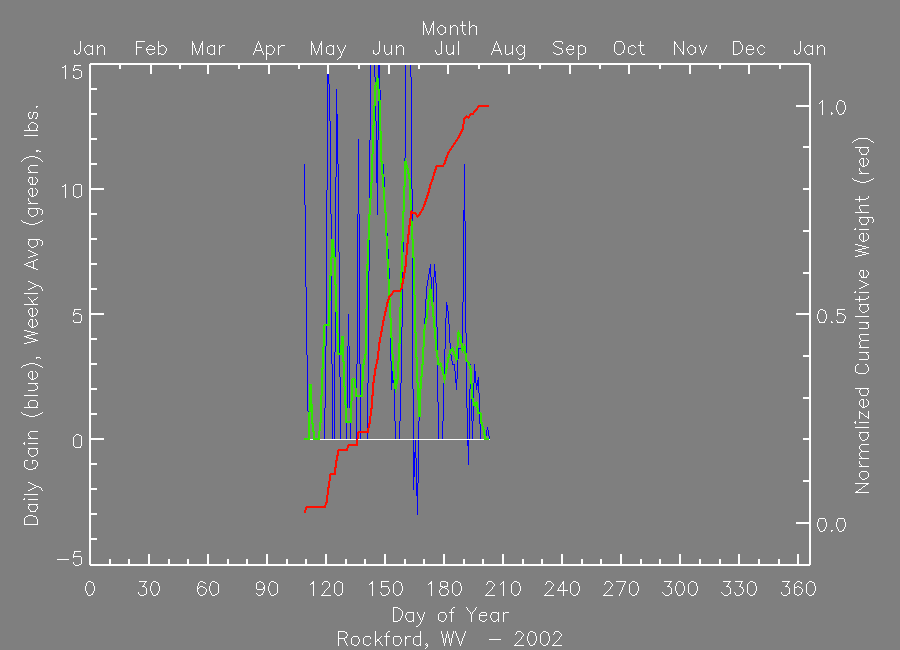
| | | Nectar Flow Data 2003 | Download Data File (comma delimited), download QA flag key 
| | | Nectar Flow Data 2004 | Download Data File (comma delimited), download QA flag key 
| | | Nectar Flow Data 2005 | Download Data File (comma delimited), download QA flag key 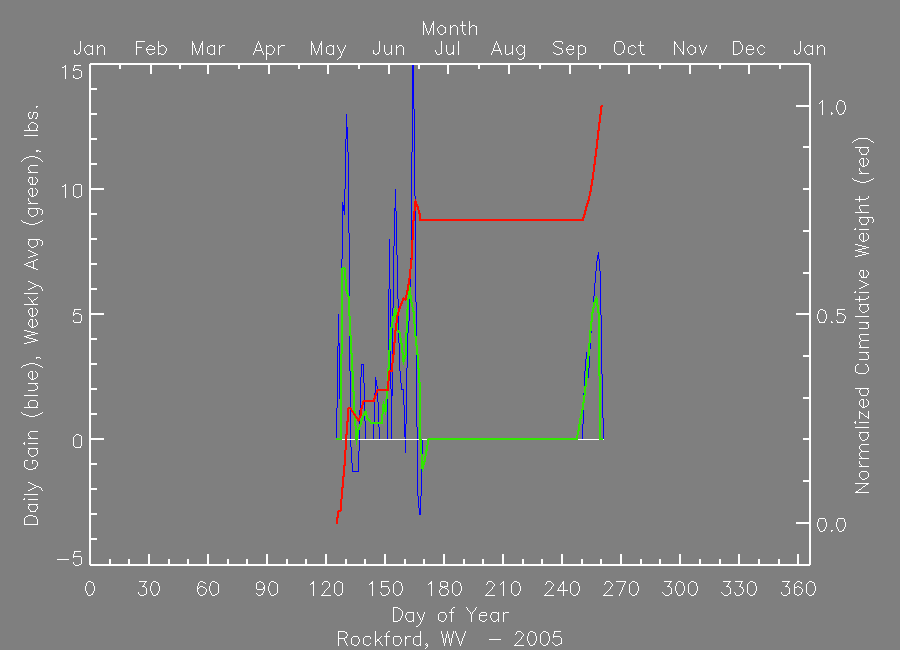
| | | Nectar Flow Data 2006 | Download Data File (comma delimited), download QA flag key 
| | | Nectar Flow Data 2007 | Download Data File (comma delimited), download QA flag key 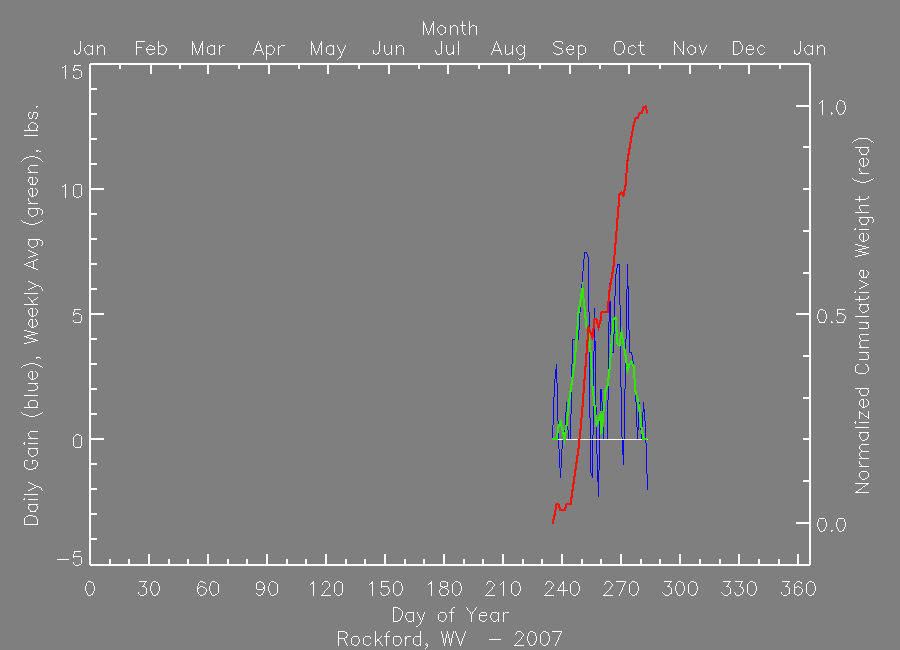
| | | Nectar Flow Data 2008 | Download Data File (comma delimited), download QA flag key 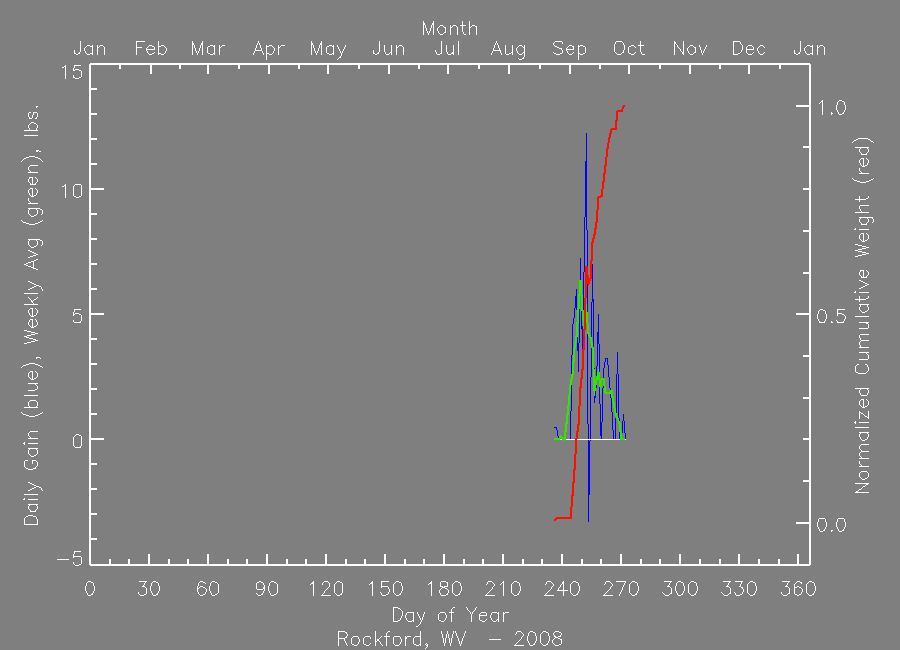
| |
|
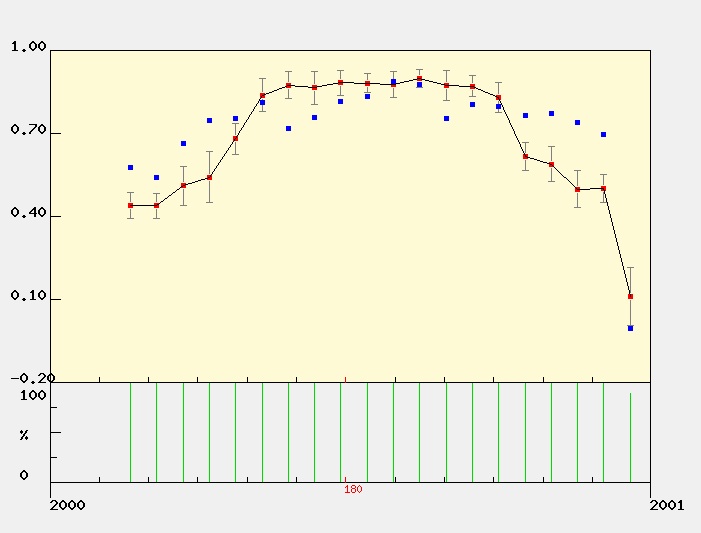
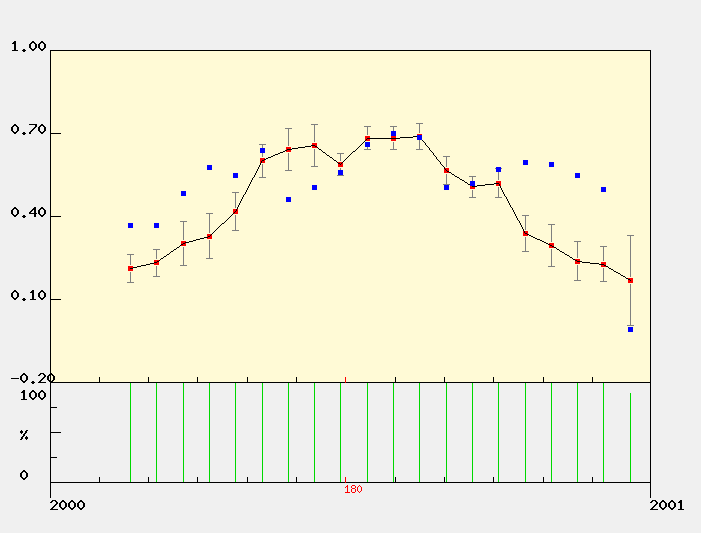
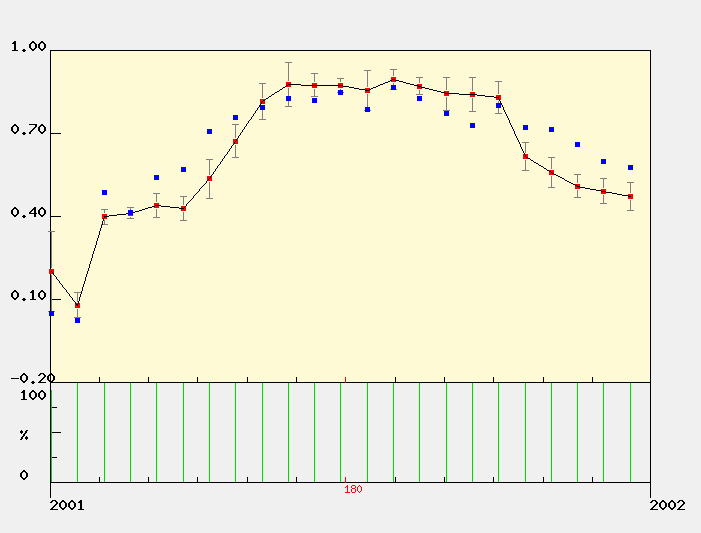
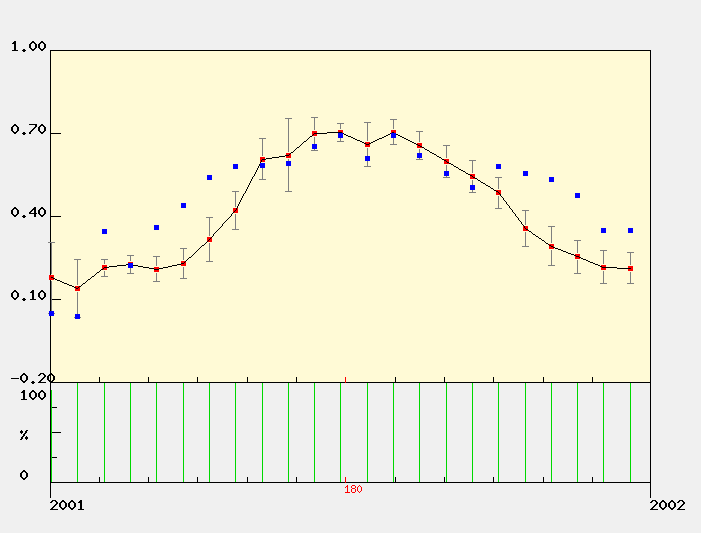
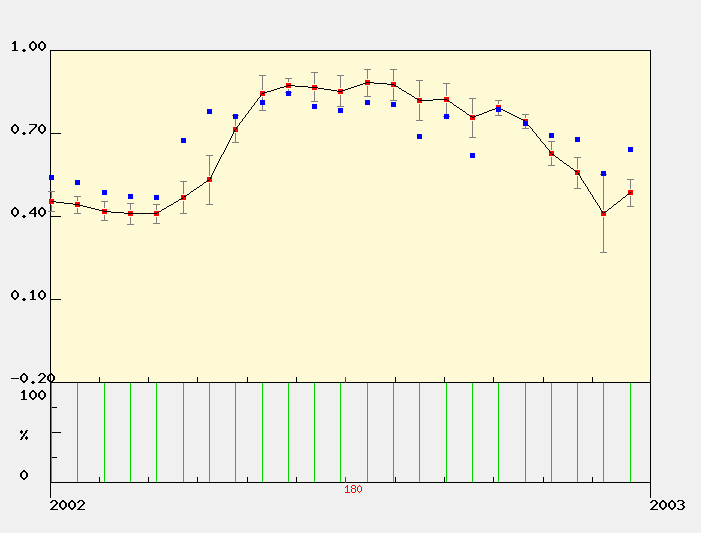
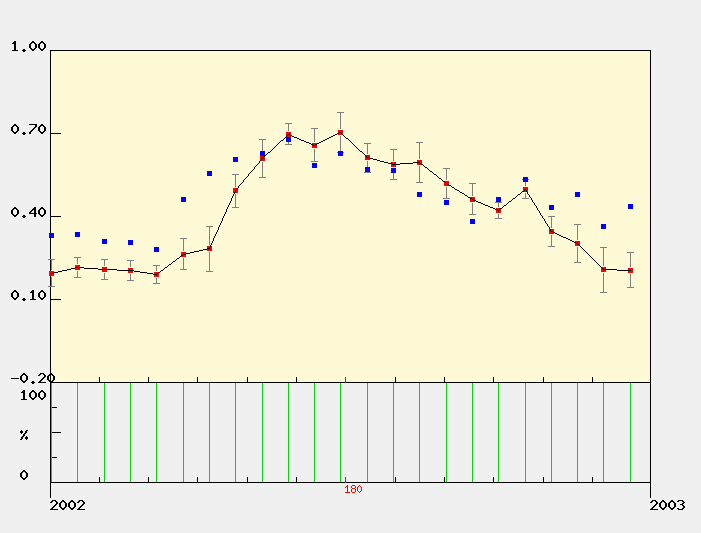
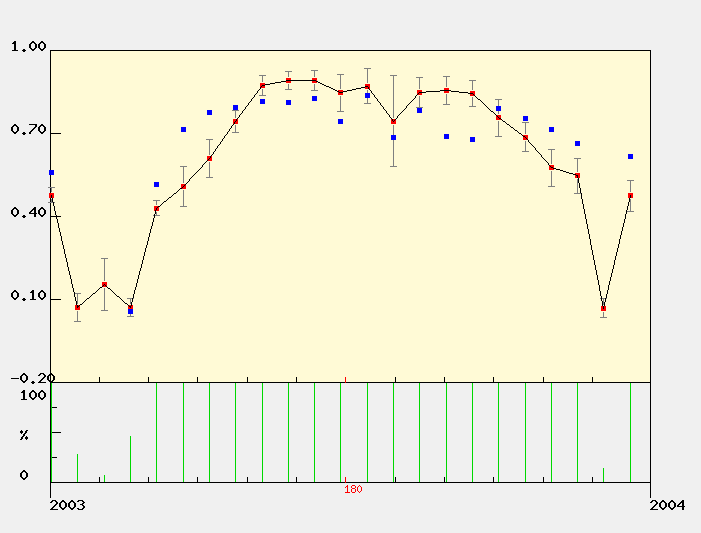
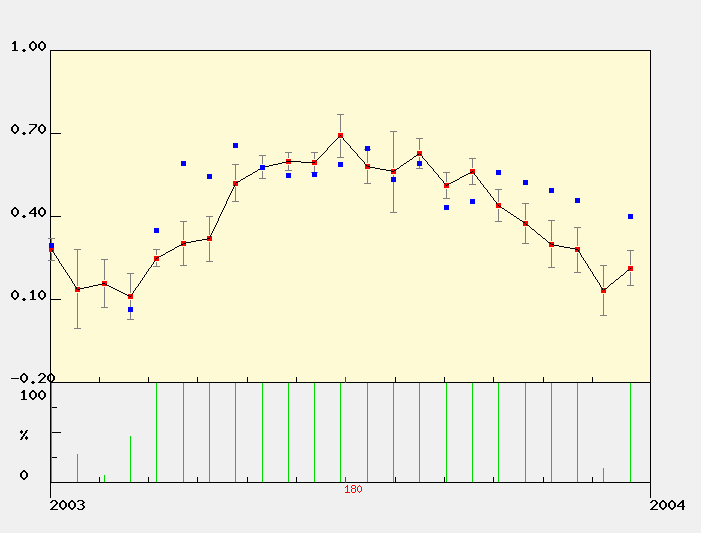
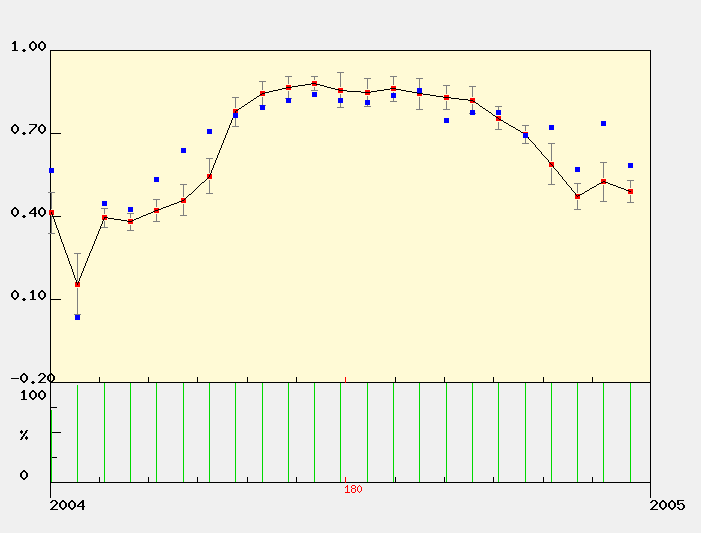
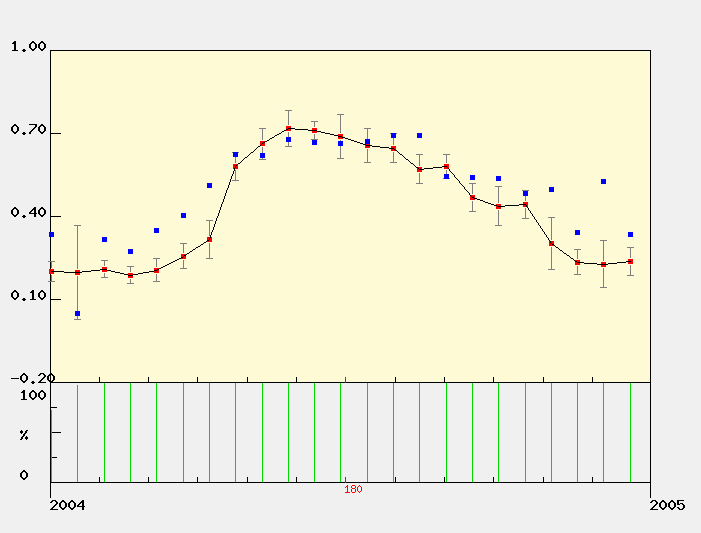
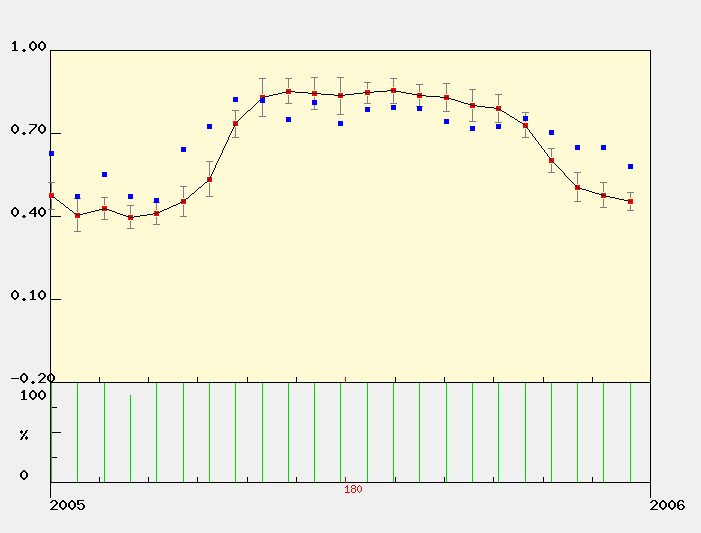
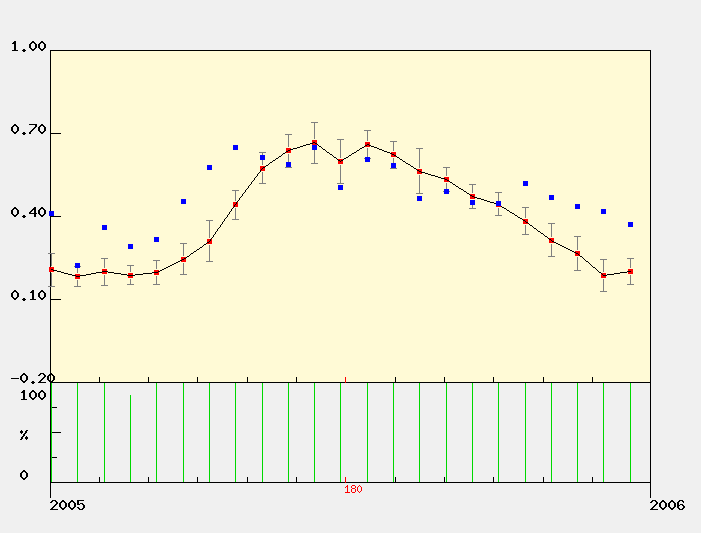
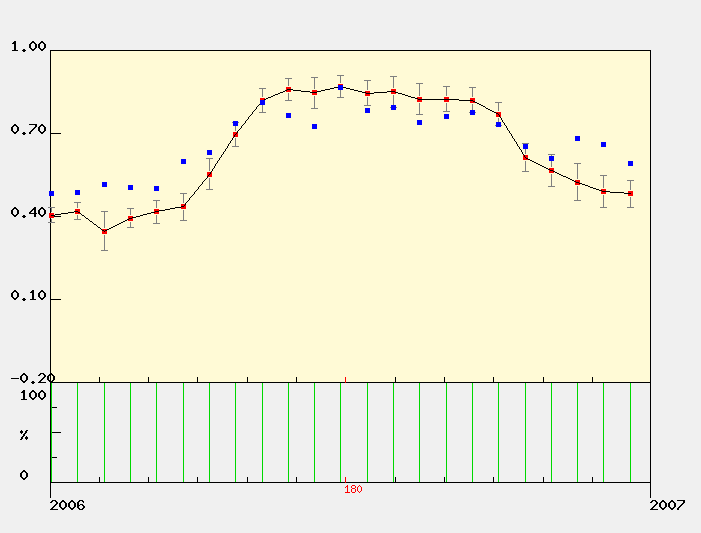
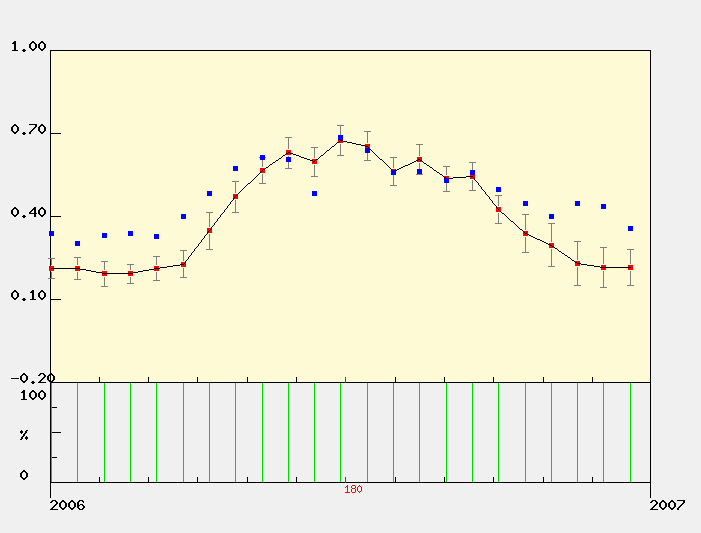
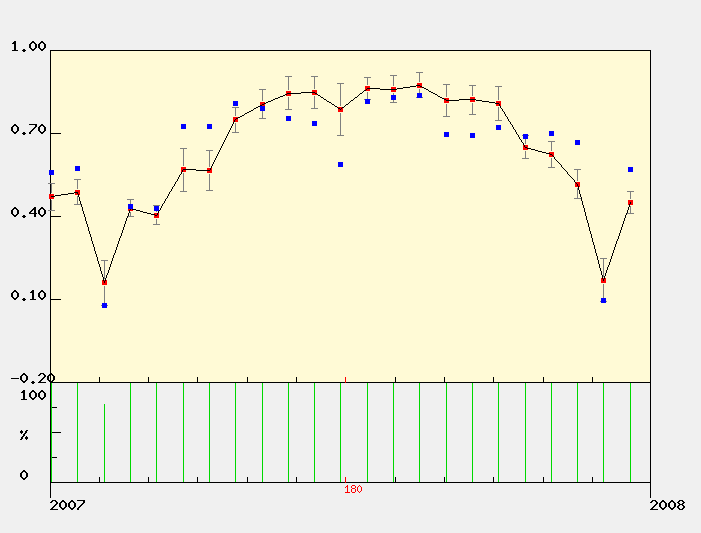
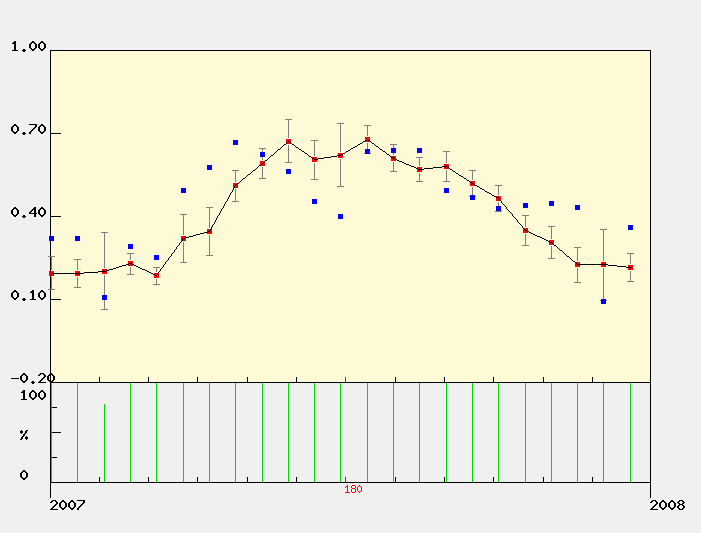
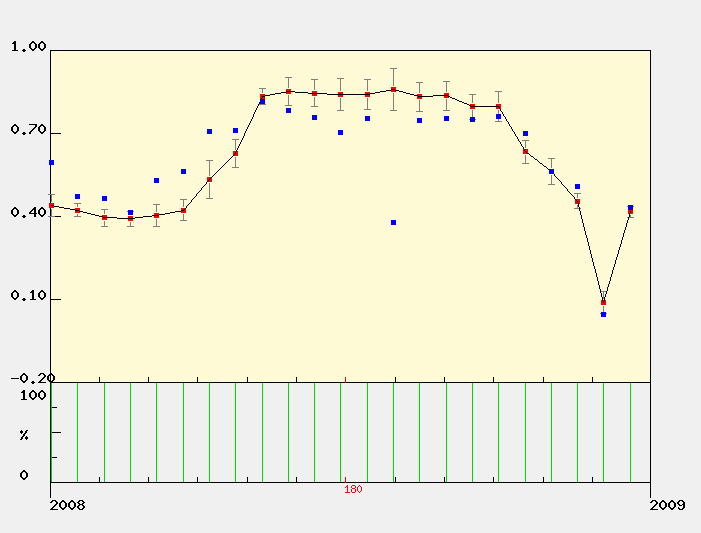
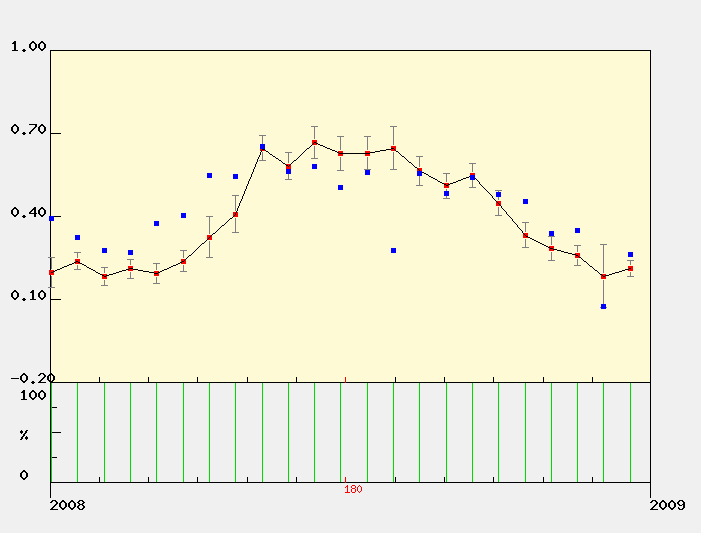
MODIS Subset Data (from the ORNL DAAC)
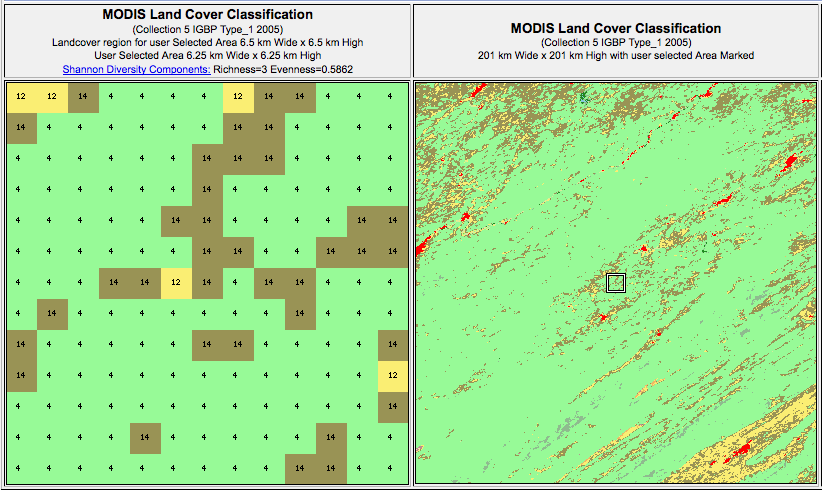
Red dots are the average of all pixels with acceptable quality (see landcover extract below for area covered).
Blue dots are the center pixel only (point is not plotted if the pixel is of unacceptable quality). |
| | | | | | | | | | | | | | | | | |
| NDVI The Normalized Difference Vegetation Index (NDVI) is the ratio of the difference between visible (red) and infra-red (IR) wavebands to the sum of these bands.
NDVI = nir - red / nir + red
NDVI provides an indication of the amount and vigor of vegetated surfaces.
NDVI has been widely used with multiple generations of satellite data.
|
 |
EVI
The Enhnaced Vegetation Index (EVI) is a more complicated combination of wavebands compared to the more widely used index, NDVI. The advantage of this newer index is improved sensitivity in high biomass regions and reduction in atmospheric influences.

where,
pNIR = NIR reflectance
pRed = red reflectance
pBlue = blue reflectance
C1 = atmosphere resistance red correction coefficient
C2 = atmosphere resistance blue correction coefficient
L = canopy background brightness
G = gain factor
|
|
The MODIS sensor on the Terra satellite platform provides us with 16-day composite measures of NDVI/EVI throughout the year. NASA distributes MODIS data from many of their distributed data centers.
|
|
|
|
MODIS Land Cover

MODIS Data Subset Citation:
Oak Ridge National Laboratory Distributed Active Archive Center (ORNL DAAC). 2007. MODIS subsetted land products, Collection 4. Available on-line [http://www.daac.ornl.gov/MODIS/modis.html] from ORNL DAAC, Oak Ridge, Tennessee, U.S.A.. |
|
| |
| |
|